Whether you’re a seasoned homeowner, a first time buyer, an experienced landlord or a long-term tenant, our guides have the answers you need to the biggest questions around home insurance. From tips on getting the right cover, to advice on how to save, you’ll find it all here.
And you can trust what we say. All our content is written to strict editorial standards that ensure we’re always honest, accurate and transparent in everything we put on the page. We also work with a panel of experts who review everything we write. They’re picked for their expertise in all things insurance, and they make sure every guide we put out is packed full of useful insight and expert information.
Get the most out of your home insurance with Confused.com.
Need help with something?
Ask us about anything
Please don't enter any personal details here. We'll ask for them later if you decide to get a quote, but for now, we can help answer your question without them.
Our top guides on how home insurance works

Will your home insurance cover neighbour damage?
You might be able to make a claim on your home insurance for damage to your home even when it‘s been caused by your neighbour.

Trace and access cover explained
Trace and access insurance covers the cost of finding the source of a leak. But how exactly does it work, and what are you actually covered for?

Working from home insurance
Your office equipment might already be covered by your home insurance. But what else should you be thinking about covering if you work from home?

What can invalidate home insurance?
Having a claim rejected could leave you out of pocket when you need your insurance the most. We take a look at common pitfalls to avoid.
More guides on how home insurance works
Our top guides on calculating your cover

How do I calculate the rebuild cost of my home?
Knowing your home's rebuild cost can help give you more accurate home insurance costs. Here's how you use a rebuild cost calculator and work it out yourself.

When was my house built?
The age of your property could impact how much you pay for your home insurance. Here's how you find out how old your house is.

How much contents insurance do I need?
Calculating the value of your contents accurately is crucial. We look at some easy ways to ensure you ensure you take out the right amount of cover for your possessions.

How much home insurance cover do I need?
Do you know how much cover you need? Our guide can help make sure you've considered everything.
More guides on calculating your cover
Our top guides on you and your home

Moving house checklist: What to do when you move into a new home
Our moving house checklist guides you through all the things you need to do when moving home. Get organised and move home with ease.

How to calculate your house's value
Thinking of selling your home? Then you'll want to know what it's worth. We look at quick and easy ways you can calculate the value of your home.

Poor workmanship: What are my rights?
What are your rights if you've experienced poor workmanship? And can you refuse to pay a tradesperson? We look into how to deal with poor workmanship.

The ultimate student moving checklist
We've put together a list so you don't forget anything when you go to university. We'll discuss how student contents insurance can protect your belongings.
More guides on you and your home
Our top guides on protecting your home

Types of door locks
Getting the right type of door lock can be a quick way to save on your home insurance. But which types should you be looking at? Find out with our handy guide.
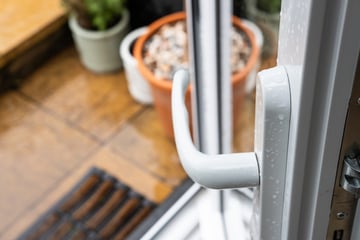
Types of patio door locks
Patio doors can be particularly vulnerable to break-ins, so fitting them out with the right type of lock is essential. We take a look at the best ones for bolstering your back door security.

Types of burglar alarms
Shoring up your security with a burglar alarm is a quick way to deter thieves. But which ones give you the best bang for your buck? We take a look.

What to do if you get burgled
Having your house burgled is a worrying experience. These steps could help you if your home's burgled or if you come home and find a burglary in progress.
Our top guides on home insurance add-ons

Home emergency cover: what counts as a home emergency?
Here's how you can protect yourself against those sudden mishaps at home.

Watch insurance
High value item like expensive watches may not be covered by your contents insurance. So what do you do if you want to cover one? We take a look.

Accidental damage insurance
Fire, theft and flood damage is covered by contents insurance. But accidental damage isn't, unless you opt for it. We take a look at how accidental damage insurance works.

Legal protection cover explained
Taking a case to court can be expensive. Legal protection helps you cover the cost. But how does it work? And how do you get it? We take a look.
More guides on home insurance add-ons
Our top guides on types of home insurance

Air BNB insurance explained
Airbnb can be a nice little side earner. But it comes with risks. We look at the cover you should think about if you're renting out a property online.

What are the different types of home insurance?
Find out about the different types of home insurance

Commercial property insurance
If you own a business, it's important to ensure you keep your premises safe.