


1. Home
  2. Car insurance
  3. Confused.com car insurance price index

The most comprehensive report on car insurance pricing in the UK

Car with map of UK and pound symbols
Confused.com C icon
Our expert panel review all content. Learn more about our editorial standards and how we operate. 

Willis Towers Watson approved

Rated: Great 4 green stars 4.5 rating based on 14507 reviews as of 10/08/2026 Trustpilot logo

Key findings and trends

Number 1 icon

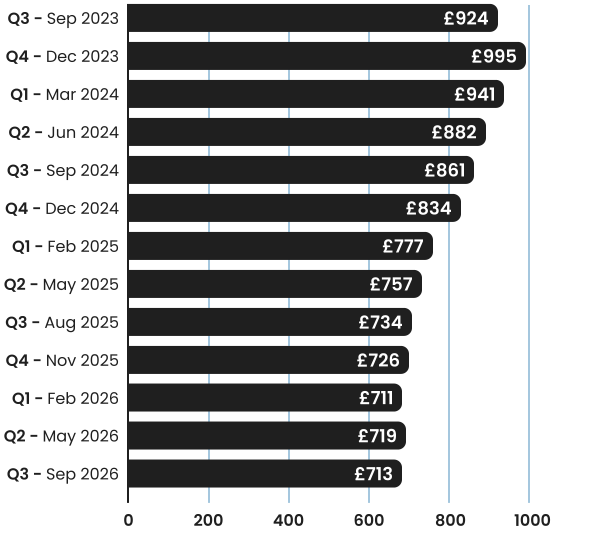
Car insurance now costs £713 on average

Prices have fallen by £22 in the past 12 months, making car insurance 3% cheaper than this time last year. If you go back further, the latest data shows that premiums are now 17% cheaper compared to 2 years ago.

Number 2 icon

Savings for young drivers, but costs remain high

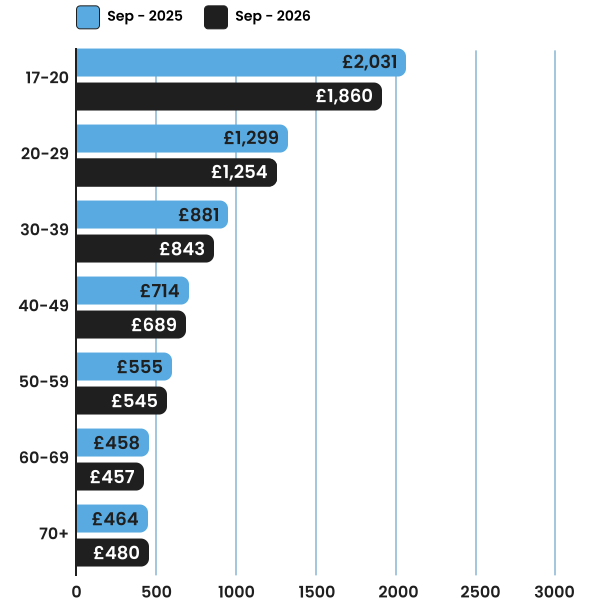
Young drivers typically see the biggest reduction in car insurance premiums despite paying the most. 17-year-olds are now paying £253 less for their car insurance than a year ago, a 13% drop.

Number 3 icon

Your postcode affects the price

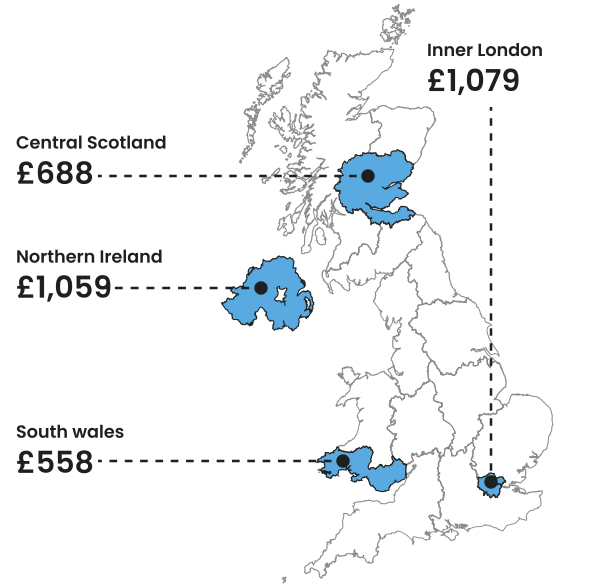
Where you live will impact how much you pay for car insurance. Drivers in Inner London, for example, pay more for car insurance compared to any other region in the UK. However, these motorists are also benefiting from the biggest reduction of car insurance costs, saving an average of £70 (-6%) year-on-year. Whereas in Northern Ireland, car insurance premiums have risen significantly by £209 (25%) in the past 12 months to £1,059 on average.

What our car insurance expert says

“When you receive your car insurance renewal price, it’s easy to think that’s the best price you’re getting. But that’s not necessarily the case.

“It’s also worth remembering that your circumstances might change from year to year. You may need a different level of cover or to change some details, and this won’t be accounted for in the renewal price you receive. Running a new quote and changing your details or requirements if you need to guarantee that you’re getting the best policy at the right value for you. And that’s true even if your price has increased slightly in the past 12 months – chances are you can still beat your renewal price if you shop around.

“If you are starting to see your price creep up, you can still make some changes to minimise the damage. Shopping around early is key and can mean you save 53% compared to buying on the day your policy renews. Also, if you might benefit from sharing the driving with someone from time to time, adding them to your policy as a named driver not only offers better protection but can save money too.”


Matt Crole Rees - Motor General Manager & Motor Insurance Expert
Motor General Manager & Motor Insurance Expert Confused.com logo

How much is car insurance?

The average cost of comprehensive car insurance in the UK is now £713, based on the latest Confused.com Car Insurance Price Index, powered by WTW.

Car insurance prices have been gradually falling since the start of 2024, after reaching record highs at the end of 2023. The graph shows how average premiums have changed over the past three years, highlighting a steady easing in prices, rather than a sudden drop.

Where this data comes from
The Confused.com Car Insurance Price Index is the most comprehensive analysis of car insurance pricing in the UK. It’s built using over 6 million real car insurance quotes, collected every quarter from drivers shopping for cover through Confused.com.

All figures refer to new comprehensive car insurance policies, unless stated otherwise, and are based on the prices drivers were actually quoted, not estimates or insurer price lists. Because we’ve been tracking this data consistently over many years, we’re able to show how prices change over time, rather than relying on one-off snapshots.

Why do prices change?
Car insurance prices usually respond to wider market conditions. They’re influenced by:

  • The cost and frequency of claims
  • Repair, parts, and labour costs
  • Levels of theft and accidents
  • Competition between insurers
Car insurance price index 2026 graph

Average car insurance cost

Quarter Cost
Q3 – Sep 2023
£924
Q4 – Dec 2023
£995
Q1 – Mar 2024
£941
Q2 – Jun 2024
£882
Q3 – Sep 2024
£861
Q4 – Dec 2024
£834
Q1 – Feb 2025
£777
Q2 – May 2025
£757
Q3 – Aug 2025
£734
Q4 – Nov 2025
£726
Q1 – Feb 2026
£711
Q2 – May 2026
£719
Q3 – Sep 2026
£713

How to reduce car insurance

If your car insurance still feels expensive, there are a few tweaks you can do to help bring costs down – without having to change or compromise your cover.

  • Add-driver icon Add another driver
    Adding a second, more experienced driver can sometimes bring your price down. Insurers may see this as lowering the overall risk on the policy, particularly for younger or newer drivers. 
  • No-claims bonus icon Protect your no-claims bonus
    Protecting your no-claims bonus can help stop your price jumping after a claim, especially if you’ve built up several years’ worth.
  • Voluntary-excess icon Change voluntary excess
    Your voluntary excess is the amount you agree to pay towards a claim. Increasing it can sometimes lower your premium, but only if it’s an amount you’d be comfortable paying if you needed to claim. Adjusting this can help you get a cheaper price without leaving you under-insured.

Explore our guide for more tips on how to save on your car insurance.

How is car insurance calculated?

Car insurance pricing is based on risk levels.

Insurers use your details to estimate how likely you are to make a claim and how much that claim could cost. The higher the risk, the higher the price. That’s why prices can vary so much from one driver to the next.

Use the Confused.com car insurance calculator to see how changes to your details could affect what you pay.

Tell us your details to get the average car insurance price for your area

Postcode region
Select an age range
Select a gender

Your age

Younger drivers still pay the most overall. 18-year-olds now pay £2,083 on average, the most of any age group, despite prices decreasing over the past 2 years. That’s because newer drivers typically have less experience and little or no no-claims history, which increases risk in the eyes of insurers.

As drivers get older, prices usually come down. On average, premiums don’t fall below £1,000 until around age 30, and they only start to look closer to the UK average in the mid-to-late 30s. From there, prices tend to level out, with drivers in their 60s paying some of the lowest amounts, at around £457, on average

Car insurance price index 2026 age image

Average car insurance cost by age

  Sep - 2025 Sep - 2026
17-20
17-20
£2,031
£1,860
20-29
20-29
£1,299
£1,254
30-39
30-39
£881
£843
40-49
40-49
£714
£689
50-59
50-59
£555
£545
60-69
60-69
£458
£457
70+
70+
£464
£480

Your location

Even if two drivers look identical on paper, living in different areas can mean very different prices. That’s because insurers take into account things like:

  • Crime and theft rates in the area

  • Traffic levels and congestion, which can increase the chance of accidents

  • How often claims happen locally, and how expensive they tend to be

This is why Inner London has continually been the most expensive area in the UK for car insurance. These drivers pay £1,079 on average but have also seen the biggest decrease in prices, paying £70 (-6%) less compared to 12 months ago.

The map shows how average prices compare across England, Scotland, Wales and Northern Ireland. 

See car insurance costs by region.

Car insurance price index 2026 regional image

Driving habits

How often you use your car might have a bigger impact on your car insurance price than you may think.

People who drive around 11,000 to 18,000 miles a year tend to pay less, while prices rise at both ends of the scale.

  • Drivers covering around 16,000 miles a year pay about £593 on average
  • Those who say they drive around 5,000 miles pay closer to £760
  • At the highest mileages, prices increase again, with drivers doing around 50,000 miles paying close to £931

That’s a difference of more than £300 a year, based on mileage alone.

Why mileage affects the price
Driving very little isn’t always cheaper. Lower mileage can mean less regular driving, which insurers may see as higher risk. On the other hand, higher mileage means more time on the road, increasing the chance of an accident.

It’s also important to be accurate. Underestimating your mileage to get a cheaper price can backfire - not only could it cost more, but being over your declared mileage when making a claim could cause problems with your cover.

The table shows how average premiums change across different mileage ranges.

Mileage
Up to 1,000
£733
Up to 2,000
£696
Up to 3,000
£724
Up to 4,000
£767
Up to 5,000
£760
Up to 6,000
£726
Up to 7,000
£709
Up to 8,000
£688
Up to 9,000
£648
Up to 10,000
£700
Up to 11,000
£604
Up to 12,000
£601
Up to 13,000
£611
Up to 14,000
£601
Up to 15,000
£666
Up to 16,000
£593
Up to 17,000
£606
Up to 18,000
£606
Up to 19,000
£617
Up to 20,000
£699
Up to 21,000
£667
Up to 22,000
£621
Up to 23,000
£632
Up to 24,000
£651
Up to 25,000
£699
Up to 30,000
£726
Up to 50,000
£931

The car you drive

Insurers look at how expensive a car is to repair or replace, how likely it is to be stolen, and how it’s performed in past claims. That’s why cars are placed into insurance groups. These groups help insurers assess risk, and they can make a noticeable difference to your premium.

In general, cars tend to be cheaper to insure if they:

  • Are less powerful and have smaller engines
  • Cost less to repair or replace
  • Have strong safety and security features
  • Are less likely to be stolen

More powerful cars, higher repair costs, or models that are targeted by thieves usually sit in higher insurance groups, which can mean your car insurance is more expensive.
Use the Confused.com car insurance group checker to see which group your car falls into and how choosing a different model could affect your insurance cost.

Car insurance group checker

We couldn't find a car with this registration.
Or

Your occupation

Insurers use occupation as one of many signals to help assess risk, based on how claims have historically varied across different roles. The type of job you have can suggest things like driving patterns, mileage and working hours.

In general, jobs that have regular hours and involve lower mileage and less time driving tend to be cheaper to insure. Retired motorists generally pay significantly less for car insurance at £349 on average.

Small wording changes can sometimes make a difference. Two job titles that sound similar can be treated differently by insurers, even if the role itself hasn’t changed.

For example, someone listed as a “Fast Food Caterer” pays £1,348 on average, while a “Caterer” pays £816 – a potential saving of £532. Likewise, a “Mechanic” pays £1,380 on average, compared to £659 for a “Mechanical Engineer” - a difference of £721.

The table shows some of the cheapest job titles for car insurance, based on average premiums.

*All data based on comprehensive car insurance quotes made by Confused.com customers between June 2026 - August 2026. Prices based on the average median price displayed. The top and bottom 10 occupations were selected based on a minimum of 2,000 quotes per occupation. ‘Alternative’ occupations may include roles where fewer than 2,000 quotes were returned.

Job title Average car insurance premium*
Police Sergeant
£330
Police Civilian Attached (staff)
£340
Local Authority Employee
£345
PA Secretary
£351
Civil Service Executive Officer
£353
Counsellor
£354
Veterinary Nurse
£357
Receptionist Doctors
£358
Invigilator
£360
Nursing Sister
£361

How much does each UK region pay?

Car insurance prices vary widely across the UK. While the overall average has fallen, some regions remain far more expensive than others.

England

England shows the widest variation in car insurance prices anywhere in the UK.

Drivers in Inner London pay the most, with average premiums of £1,079, even with prices falling by 6% over the past year. Other large cities and urban areas also tend to be more expensive, where traffic levels, theft and claims costs are likely to be higher.

The South West is the cheapest region in England, with drivers paying £550 on average.

Outer London and the North West of England have also seen 6% price drops over the past year, where premiums have fallen by £55 and £46, respectively, on average.

Region Average car insurance premium
South West England
£550
North East England
£625
South East England
£635
East of England
£652
East Midlands
£672
Yorkshire & the Humber
£717
North West England
£718
West Midlands
£781
Outer London
£905
Inner London
£1,079

Wales

Car insurance in Wales is generally cheaper than the UK average, though prices still vary depending on where you live. Drivers in Central and North Wales pay the least, with average premiums of £517. Prices are higher in South Wales, where larger cities like Cardiff tend to see higher traffic levels. Here, drivers pay around £558 on average.

Overall, prices across Wales have continued to fall over the past year, helping to keep premiums relatively stable compared to some other parts of the UK.

Region Average car insurance premium
Wales - Central & North
£517
Wales - South
£558

Scotland

Car insurance in Scotland remains relatively affordable overall, but prices are rising across every region. Drivers in the Scottish Borders pay the least, with average premiums of £536. Prices are higher in Central Scotland, where larger cities like Glasgow and Edinburgh see more congestion and potentially higher claim costs. Here, drivers pay around £688 on average.

Elsewhere, premiums sit somewhere in between. Drivers in East and Northeast Scotland pay around £599, while those in the Highlands and Islands pay £551 on average.

In Central Scotland, prices have increased by £20 (3%), and in other parts of Scotland, prices are as much as £10 more expensive compared to 12 months ago.

This is a marginal increase, but car insurance costs here are relatively low compared to the UK average.

Region Average car insurance premium
Scotland - Borders
£536
Scotland - Central
£688
Scotland - East & NE
£599
Scotland - Highlands & Islands
£551

Northern Ireland

Northern Ireland is one of the more expensive parts of the UK for car insurance, with average premiums of £1,059.

While car insurance premiums have increased minimally in Scotland year-on-year, prices in Northern Ireland have risen significantly over the past 12 months by £209 (25%). This suggests different market conditions compared to the rest of the UK.

Region Average car insurance premium
Northern Ireland
£1,059

How we conducted this research

The Confused.com Car Insurance Price Index is based on more than 6 million real car insurance quotes, collected every quarter from drivers shopping for cover through Confused.com. This makes it the most comprehensive analysis of car insurance pricing in the UK.

The data used in this report was collected in Q3 2026 and reflects the prices drivers were actually quoted, rather than estimates or insurer price lists. Unless otherwise stated, all prices refer to new comprehensive car insurance policies.

Image of a laptop

See how much you could save on your car insurance

Get a quote