


This page includes relevant UK student cost of living statistics for 2024, such as:
- Average student spending per month (such as average cost of student accommodation, utility bills, and food)
- Average student income statistics and where most students typically get their money from
- Student contents insurance statistics (by age, gender, and region)
Latest figures show that, as of 2021-22, there were 2.86 million university students in the UK, accounting for around 4.24% of the population. Students spent an average of £1,078 each month in 2023, an increase of 17% from 2022. UK students are feeling the pinch as much as other groups.
Given the current cost of living crisis, we’ve collated a range of student cost of living statistics for 2024, including:
- Average student income statistics
- Average cost of student living (such as rent, food, and bills)
- Government support available for students during the cost of living crisis
Top 10 UK student cost of living statistics
- Student living costs at university were more than £900 in every region in 2023, up £100 from a year earlier
- Around four-fifths (82%) of students have financial worries while at university
- The average student maintenance loan was around £496 per month, or £5,952 a year
- Around 2 in 3 (64%) admitted that their student loan did not adequately cover living costs while at university
- Over half of (56%) of students earn an income via part-time jobs
- Students spent an average of £1,078 each month in 2023, an increase of 17% in comparison to 2022
- 1 in 5 (18%) students used food banks in 2023
- 73% of students choose not to put the heating on to reduce their energy bills, up 2% from 2022
- Based on Confused.com data, the average cost of student contents insurance was £72 a year
- According to our survey, more than half (58%) of UK students don’t have contents insurance while at university.
Are you or someone you know heading off to university? Check out our ultimate student moving checklist to ensure you’ve got everything sorted before you leave.
Average student cost of living statistics
The average student living costs for university students have changed considerably since 2022. Save the Student’s money survey found that the average cost of living was above £800 for each region in the UK.
By contrast, this was the first time in the history of the survey that living costs were over £900 for every region in 2023. In 8 out of 12 regions, the average was over £1,000 per month.
A breakdown of student living cost broken down by region

Stats on student living costs show that London is still the UK’s priciest region. Students there spend an average of £1,211 per month, or £14,532 per year. This is 1.5% more than the next most expensive region, the South West, and a third (33%) more expensive than Northern Ireland.
Back in 2021, London students paid £896 per month (the highest at the time), but this has since increased by over a third (35%).
In England, the region with the lowest monthly costs is the West Midlands, with monthly costs of £905. This is 16% less than the national average.
A breakdown of student living costs around the UK, by region
| Rank | Region | Average student living costs (2023) | Average student living costs (2022) | Difference |
|---|---|---|---|---|
|
1
|
London
|
£1,211
|
£1,089
|
Up 11%
|
|
2
|
South West
|
£1,193
|
£962
|
Up 24%
|
|
3
|
East England
|
£1,181
|
£959
|
Up 23%
|
|
4
|
South East
|
£1,083
|
£935
|
Up 16%
|
|
5
|
Wales
|
£1,077
|
£852
|
Up 26%
|
|
6
|
West Midlands
|
£1,070
|
£822
|
Up 30%
|
|
7
|
Scotland
|
£1,036
|
£932
|
Up 11%
|
|
8
|
North West
|
£1,007
|
£933
|
Up 8%
|
|
9
|
Yorkshire and the Humber
|
£995
|
£906
|
Up 10%
|
|
10
|
North East
|
£954
|
£837
|
Up 14%
|
|
11
|
East Midlands
|
£905
|
£832
|
Up 9%
|
|
12
|
Northern Ireland
|
£904
|
£836
|
Up 8%
|
When comparing responses from 2022 and 2023, the West Midlands saw the biggest increase in living costs (+30%), followed by the South West (+24%) and the East (+23%).
Comparatively, the regions with the lowest increase in student living costs between 2022 and 2023 were Northern Ireland, the North West (+8%) and the East Midlands (+9%).
Average student income per month
How much is the average student income per month in the UK?
Statistics from Natwest reveal that Cardiff students typically have the highest average student income per month during term-time in the UK. At £3,328, this is marginally more than those at Bournemouth but around £435 more than the average UK student.
A breakdown of the highest and lowest average student income per month at different universities across the UK

At the other end of the scale, students studying in Edinburgh have the lowest average income per month, at £1,454 per student. This is around £150 a month less than those attending Glasgow, and around half the national average.
What are the main sources of income for university students in the UK?
Statistics from Save the Student show that more than half receive an income from a part-time job. This is a fall of 8 percentage points since 2022, when the figure was more than 6 in 10 (62%).
A breakdown of how students get their money

The number of students receiving money from parents has also decreased. Close to 3 in 5 (59%) received money from their parents in 2022, which fell to 53% in 2023.
More than a third (35%) rely on an overdraft to get them through the month, while a fifth (21%) also use credit cards. This reflects the fact that students' spending can lead them to rack up debts after they finish studying.
In terms of the more unusual methods of making money, almost 1 in 20 (4%) make money from social media, investing in cryptocurrencies, or stocks and shares.
Statistics on student maintenance loans across the UK
According to UK student finance statistics, the government spent over £4.5 billion on higher education in 2022-23.
The latest figures for 2024 reveal the average student maintenance loan for UK students was around £496 per month, or £5,952 a year. This represents an increase of 2.2% since 2022 and a rise of 5% since 2021. However, this rise has not been in line with increasing living costs. But this can vary depending on:
- Whether you live in London or not
- Where you’re living while studying (i.e. at home or away from home)
- Your combined household income
According to Save the Student, in 2023, the gap between the maintenance loan and monthly living costs equalled £582 per month. This means that it makes up less than half (46%) of a student’s monthly living costs.
This is in comparison to 2022 when the maintenance loan made up more than half (52%) of student loans, and 2021 when the maintenance loan accounted for nearly three-fifths (58%) of monthly living costs.
England 2024-25 maintenance loan statistics
The maximum amount a student studying in England can get for a maintenance loan and grant package is £13,348. This is available to students living away from home and in London, with a combined household income of £25,000 or less.
A breakdown of maintenance loan amounts in England for the 2024-25 academic year
| Household income | Living at home while studying | Away from home while studying (outside London) | Away from home while studying (London) |
|---|---|---|---|
|
£25,000 or less
|
£8,610
|
£10,227
|
£13,348
|
|
£30,000
|
£7,887
|
£9,497
|
£12,606
|
|
£35,000
|
£7,163
|
£8,766
|
£11,863
|
|
£40,000
|
£6,440
|
£8,035
|
£11,120
|
|
£42,875
|
£6,024
|
£ 7,614
|
£10,962
|
|
£45,000
|
£5,716
|
£7,304
|
£10,377
|
|
£50,000
|
£4,993
|
£6,573
|
£9,634
|
|
£55,000
|
£4,269
|
£5,842
|
£8,891
|
|
£60,000
|
£3,790
|
£5,111
|
£8,148
|
|
£65,000
|
£3,790
|
£4,767
|
£7,405
|
|
£70,000
|
£3,790
|
£4,767
|
£6,662
|
|
£70,040+
|
£3,790
|
£4,767
|
£6,647
|
The minimum maintenance loan and grant package available for English students is £3,790. This is available to those with a combined household income of £60,000 or more, and who are living at home while studying at university.
The amount of maintenance loan you get depends on your exact household income. For example, £32,565, rather than a band, such as £30,000 - £35,000.
Wales 2024-25 maintenance loan statistics
The Welsh government offers students a combination of maintenance loans and grants. Similar to other parts of the UK, this depends on your household income and where you’re living and studying.
Welsh students in the same living situation all get the same amount of money. The difference is how much of that falls under a grant or maintenance loan.
A breakdown of maintenance loan amounts in Wales for the 2024-25 academic year
| Household income | £18,370 or less | £25,000 | £35,000 | £45,000 | £59,200+ | |
|---|---|---|---|---|---|---|
|
Living at home while studying
|
Grant
|
£6,885
|
£5,930
|
£4,488
|
£3,047
|
£1,000
|
|
|
Loan
|
£3,430
|
£6,947
|
£5,827
|
£7,268
|
£9,315
|
|
|
Total
|
£10,315
|
£10,315
|
£10,315
|
£10,315
|
£10,315
|
|
Away from home while studying (outside London)
|
Grant
|
£8,100
|
£6,947
|
£5,208
|
£3,469
|
£1,000
|
|
|
Loan
|
£4,050
|
£5,203
|
£6,942
|
£8,681
|
£11,150
|
|
|
Total
|
£12,150
|
£12,150
|
£12,150
|
£12,150
|
£12,150
|
|
Away from home while studying (London)
|
Grant
|
£10,124
|
£8,643
|
£6,408
|
£4,174
|
£1,000
|
|
|
Loan
|
£5,046
|
£6,527
|
£8,762
|
£10,996
|
£14,170
|
|
|
Total
|
£15,170
|
£15,170
|
£15,170
|
£15,170
|
£15,170
|
Similar to the rest of the UK, maintenance loans in Wales are based on exact household incomes, rather than bands.
The maximum amount a student studying in Wales can get for a maintenance loan and grant package is £15,170. This is available to students living away from home and in London.
The minimum maintenance loan and grant package available for Welsh students is £10,315, and is available to those living at home while studying at university.
Scotland 2024-25 maintenance loan statistics
The funding body in Scotland for university students is the Student Awards Agency Scotland (SAAS). They offer bursaries and grants as part of their student finance package.
Like other parts of the UK, the amount you get depends on your household income. But, unlike other areas, it’s not dependent on where you’re studying, and is based on bands rather than exact income levels.
A breakdown of maintenance loan amounts in Scotland for the 2024-25 academic year
| Household income | Loan | Bursary | Total |
|---|---|---|---|
|
£20,999 or less
|
£9,400
|
£2,000
|
£11,400
|
|
£21,000 to £23,999
|
£9,400
|
£1,125
|
£10,525
|
|
£24,000 to £33,999
|
£9,400
|
£500
|
£9,900
|
|
£34,000
|
£8,400
|
£0
|
£8,400
|
The maximum maintenance loan and bursary package available for Scottish students is £11,400. This is eligible to those from the lowest income bracket (less than £20,999 a year), with just under a quarter of this (£2,000) coming from a grant.
The minimum maintenance loan and grant package available in Scotland is £8,400. This is eligible to those in the highest income bracket (£34,000 a year and above) and is made up entirely of a loan.
Northern Ireland 2024-25 maintenance loan statistics
In addition to maintenance loans, Student Finance Northern Ireland offers students a grant. Your level of household income and where you’re studying determine how much of your student finance package is made up of grant and loan.
A breakdown of maintenance loan amounts in Northern Ireland for the 2024-25 academic year for those living at home
| Household income | £19,203 or less | £25,000 | £30,000 | £35,000 | £41,540 | £45,000 | £50,451+ |
|---|---|---|---|---|---|---|---|
|
Grant
|
£3,475
|
£2,201
|
£1,125
|
£689
|
£1,125
|
£0
|
£0
|
|
Loan
|
£3,135
|
£3,605
|
£4,035
|
£4,561
|
£5,250
|
£4,740
|
£3,938
|
|
Total
|
£6,610
|
£5,806
|
£5,250
|
£5,250
|
£5,250
|
£4,740
|
£3,938
|
The minimum amount available for students in Northern Ireland living at home while studying is £3,938. This is available to those from a combined household income of more than £50,451, and is entirely made up of the student loan.
The maximum amount available to Northern Ireland students living at home while at university is £6,610. This is an almost even split between loan and grant.
A breakdown of maintenance loan amounts in Northern Ireland for the 2024-25 academic year for those living away from home and outside of London
| Household income | £19,203 or less | £25,000 | £30,000 | £35,000 | £41,540 | £45,000 | £53,035+ |
|---|---|---|---|---|---|---|---|
|
Grant
|
£3,475
|
£2,201
|
£1,125
|
£689
|
£1,125
|
£0
|
£0
|
|
Loan
|
£4,661
|
£5,131
|
£5,561
|
£6,087
|
£6,776
|
£5,530
|
£5,084
|
|
Total
|
£8,136
|
£7,332
|
£6,776
|
£6,776
|
£6,776
|
£5,530
|
£5,084
|
The minimum amount available for students in Northern Ireland living away from home and studying outside of London is £5,084. This is available to those from a combined household income of more than £53,035, and is entirely made up of the student loan.
The maximum amount available in Northern Ireland to students living away from home while studying outside of London is £8,136. This is made up of 57% loan and 43% grant.
A breakdown of maintenance loan amounts in Northern Ireland for the 2024-25 academic year for those living away from home and in London
| Household income | £19,203 or less | £25,000 | £30,000 | £35,000 | £41,540 | £45,000 | £50,451+ |
|---|---|---|---|---|---|---|---|
|
Grant
|
£3,475
|
£2,201
|
£1,125
|
£689
|
£0
|
£0
|
£0
|
|
Loan
|
£7,377
|
£7,847
|
£8,277
|
£8,803
|
£9,492
|
£8,246
|
£7,121
|
|
Total
|
£10,852
|
£10,048
|
£9,492
|
£9,492
|
£9,492
|
£8,246
|
£7,121
|
The minimum amount available for students in Northern Ireland living away from home while studying in London is £7,121. This applies to those with a household income of more than £50,451, and is entirely made up of the student loan.
The maximum amount available to Northern Ireland students living away from home and studying in London while at university is £10,852. This is available to those from the lowest income bracket (£19,203 or less) and is made up of around two-thirds loan (68%) and one-third (32%) grant.
Average student spending statistics per month
Overall, the average monthly expenditure of UK students fell by 9% between 2022 and 2023.
Natwest’s Student Living Index shows that a typical UK student spends an average of:
- £25 a month on studying (down 62% from 2022)
- £53 a month on going out (down 24% from 2022)
- £31 a month on hobbies (down 66% from 2022)
- £10 a month on home entertainment (down 83% from 2022).
A breakdown of the average monthly spend for students on different activities in the UK
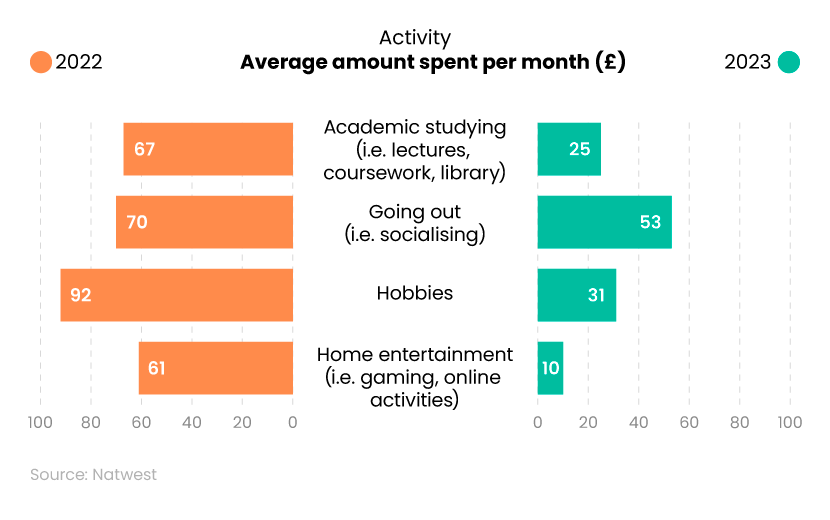
In total, an average student spends £119 a month on different activities in 2023, compared to £290 in 2022.
In 2023, around 44% of a typical student’s expenditure on activities was for going out, with just over a quarter (26%) on pursuing hobbies.
Average student spending statistics by category
On average, students spend £1,078 each month. Average student spending statistics show that, due to the cost of living crisis, student spending rose by close to a fifth (17%) from 2022. Back then, the average monthly expenditure was £924. A rise of a third (33%) compared to the monthly spending of £810 a year earlier in 2021.
Average student spending per month statistics show that, in 2023, students spent £439 a month on rent. This is 5% more than what they were spending on rent in 2022.
This means that rent takes up two-fifths (40%) of monthly expenditure. This is a lower percentage than in previous years, when rent made up 45% of monthly expenditure in 2022, and just over half (51%) in 2021.
A breakdown of the average student spend by category

Between 2021 and 2023, the monthly cost of groceries has risen by close to a third from £101 to £131. Despite this, the cost of groceries still makes up just 12% of a student’s monthly expenditure.
The cost of bills has also increased substantially, rising by 97.5% from £40 in 2021 to £79 in 2023. In 2021, bills weren’t among a UK student’s top 4 costs, whereas in 2023, they were their third biggest expense.
The UK universities where students spend the most, on average
Statistics from Save the Student show that Arden University, based in Coventry, has the highest monthly costs, with students spending £987 per month (excluding rent). This is more than (54%) more than the average national monthly cost of £639.
A breakdown of the UK universities where students spend the most on average
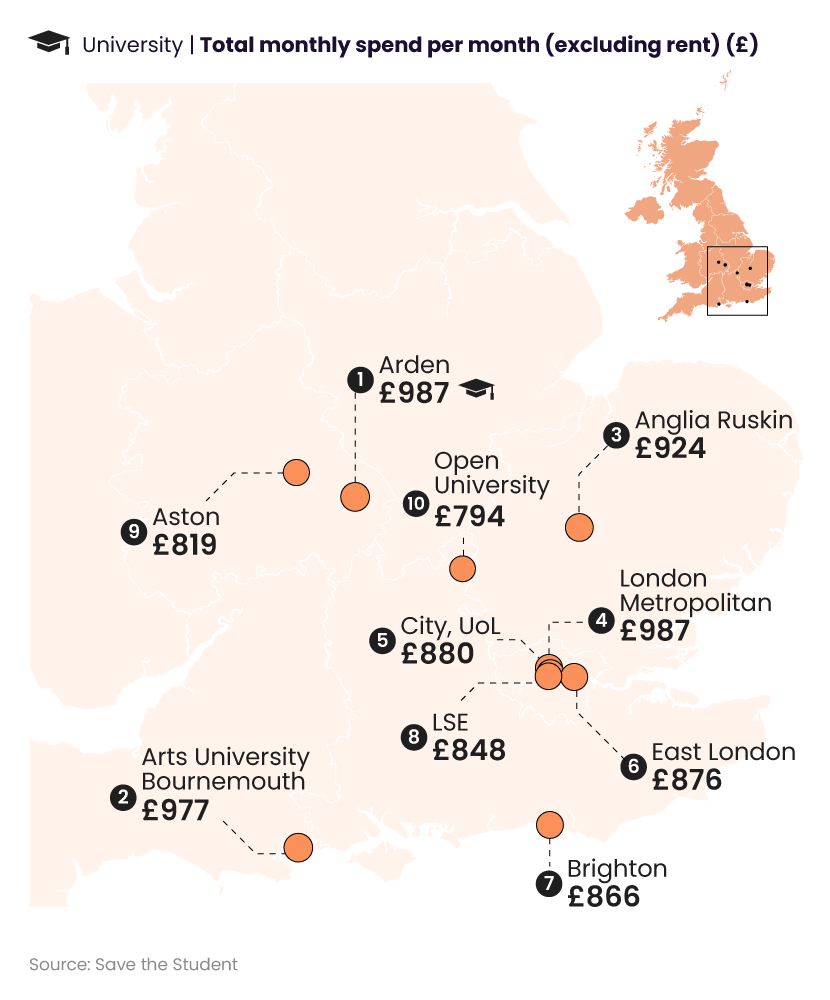
The statistics also show that 4 of the top 10 universities for monthly costs are based in London (London Metropolitan, City of London, East London, and LSE). The most expensive London-based university is London Metropolitan, where students' living costs are 38% more than the cheapest university, the University of Nottingham.
Only 2 of the universities with the highest living costs (Aston and Open University) are outside of the south of England. The most expensive university in London, London Metropolitan, has living costs that are 37% greater than the national average.
Want to save money on your car insurance while at university? Consider temporary student car insurance as a way of still having access to your car, but keeping the overall cost down.
What is the average cost of student accommodation in the UK?
Data from Save the Student shows that London is the region with the highest rent, at £778 each year. This is more than half (54%) of what students pay in the East Midlands and 57% more than what students in the North West pay.
A breakdown of the average cost of student rent in each region
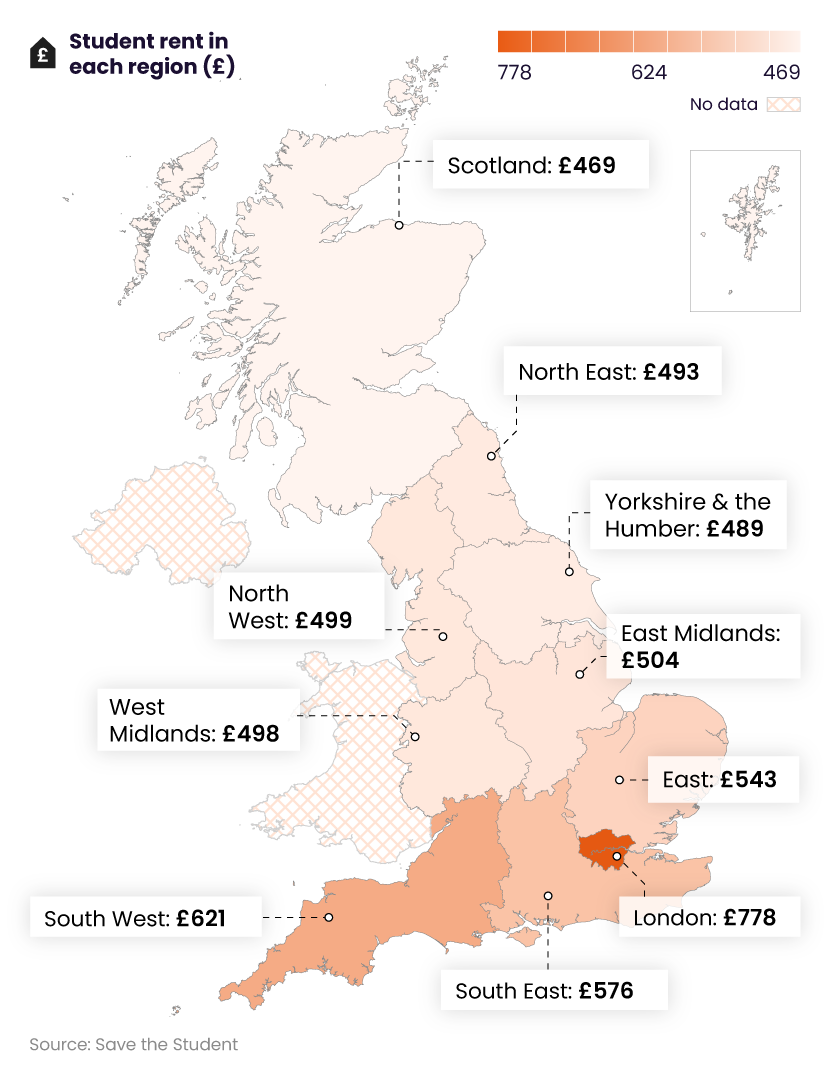
The second most expensive region for rent is the South West. Students in this region pay 8% more than those in the South East (who pay £576), and 14% more than those in the East of England.
The region where students pay the least is Scotland, paying £469 per month. This is 5% more than in the North East and 6% more than what students pay in the North West.
How much are average student bills per month in the UK?
Student statistics show that the average student energy bills were £86 per month in 2024. This is £1 higher than in the 2023 equivalent of the survey, however, it is a 38% increase in comparison to 2022.
A breakdown of what students are doing to cut down on energy costs

When asked how they are trying to reduce their energy bills, the most common answer in 2024 was to not put the heating on. Close to three-quarters (73%) of students answered this way – 2% more than the year before.
The next most common answer was to stay in bed longer, which is what more than 3 in 5 (62%) students said they had done to reduce spending on energy bills. This was followed by having fewer or shorter showers (46%).
Not putting the heating on at all was the only response that garnered more approval in 2024 than in 2023. The biggest reduction in responses was for spending longer at university to avoid using electricity and gas at home. This was a method used by close to half of students (48%) in 2023, but only 2 in 5 (40%) did this to reduce their energy bills in 2024.
For more information, check out our guide on how to save money on your student energy bills while at university.
How much does the average uni student spend on food in the UK?
Student cost of living statistics show that in 2023, the average student spent £199 per month on food. A third (33%) of this expenditure was spent on takeaways, with students spending £66 on average every month, while £133 was spent on groceries.
The total figure of £199 is a fifth (20%) more than the figure for 2022, when students were spending £165 a month on food.It’s also two-fifths (40%) greater than the figure of £142 per month for 2021.
In terms of students struggling with the cost of living, nearly a fifth (18%) stated that they used food banks in 2023. In 2022, this figure was just 1 in 10 (10%), meaning that the percentage has almost doubled.
In 2023, close to two-thirds (64%) of students said that they skipped meals at least some of the time to save money. As part of this, more than a fifth (22%) of respondents said that they often skip meals, while a further two-fifths (42%) said that they do it some of the time.
With the rising cost of living affecting students, Save the Student’s money survey found that nearly 1 in 5 (18%) students used food banks in 2023. A further 64% of students said they skip meals to save money, including 22% who ‘often’ skip meals and a further 42% who ‘sometimes’ do.
A breakdown of the highest and lowest average monthly spend on alcohol for UK students
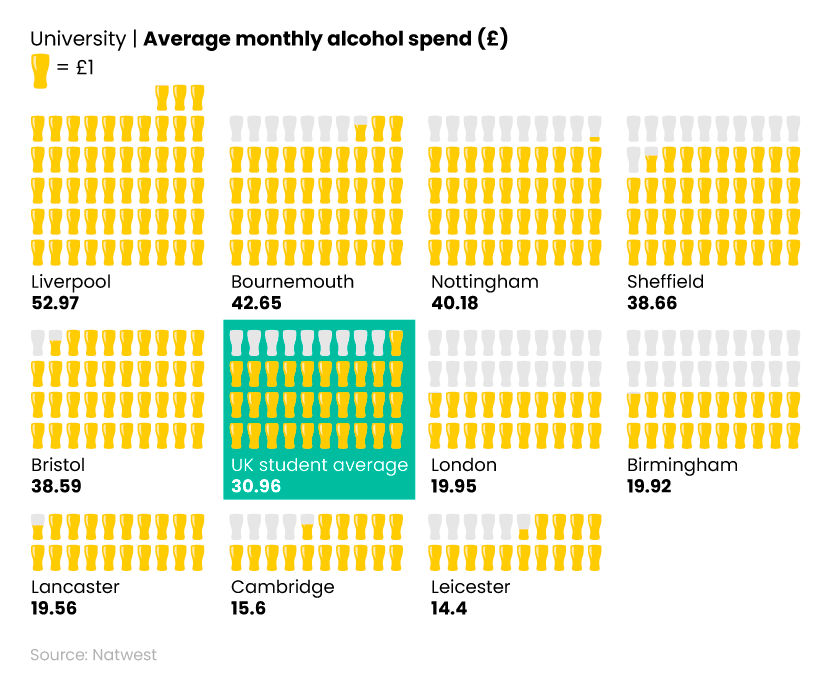
Overall, average student spending per month on alcohol dropped by almost a third (29%) between 2022 and 2023.
Another fact revealed by Natwest’s report was that Liverpool students are the biggest spenders on alcohol (£52.97 a month). This is 52% more than the national average figure of £30.96.
Students in Leicester have the lowest average monthly spend on alcohol at £14.40 a month – less than a third compared to students in Liverpool.
A breakdown of the highest and lowest average monthly spend on takeaways for UK students
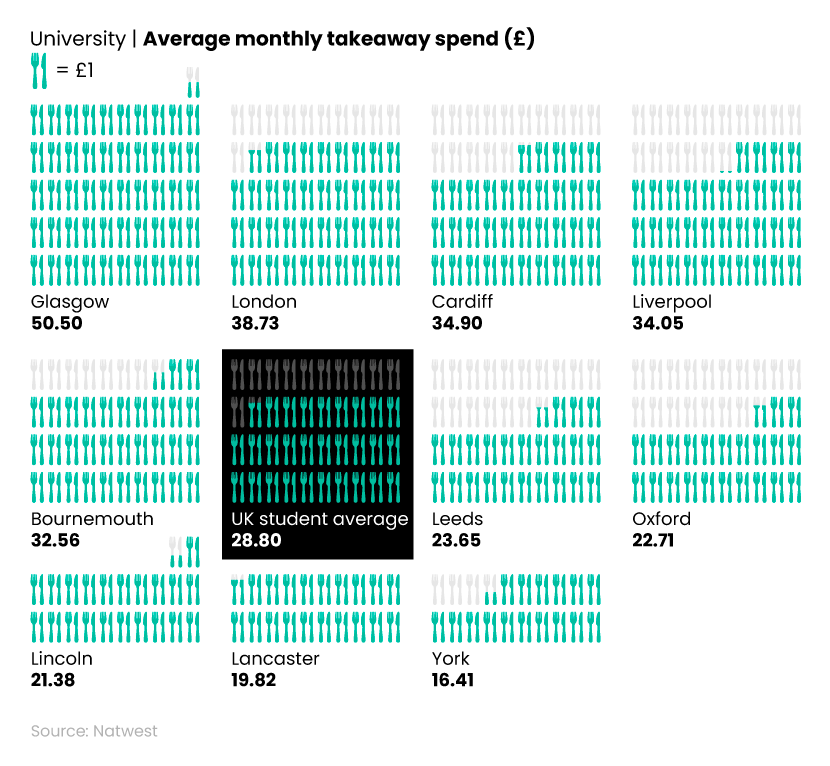
In terms of average student monthly spending on takeaways, those in Glasgow have the highest typical amount at £50.50 per month. This is almost double the national average figure of £28.80 per student per month.
Whereas, York students spend an average of £16.41 on takeaways each month – around a third compared to Glasgow students.
UK student contents insurance statistics
Student contents insurance covers student belongings while at university and living away from home. Home insurance normally covers items up to the value of £1,000-£1,500 against fire, theft, damage, or loss. But this can vary depending on the insurer and policy details.
The National Student Accommodation Survey 2023 found that 1 in 20 students have experienced a break-in while at university, so it’s worth making sure your valuables are covered while away from home.
According to our collection of UK home insurance statistics, this figure for UK adults is around 1.2%. This suggests students are around 4 times more likely to be burgled than the general UK adult population.
UK average cost of student contents insurance
According to Confused.com data, the average cost of student contents insurance in 2024 is £72 per year (based on quotes between January and March 2024).
But, your insurance price can be influenced by:
- The area you live in
- Whether you have any higher-value items on your policy
- Whether you use items away from home
For example, the average cost of student contents insurance with a high-value listed item was £80 per year between January and March 2024. Policies with non-high value items, which were only used in student accommodation, had an average price of £62.
According to UK contents insurance statistics, a typical student could easily have more than £3,000 worth of possessions when they head off to university. Finding the right cover is, therefore, important if students are to be adequately protected against loss, damage, and theft while away from home.
Average time spent by university students doing different tasks
How much time does the average UK student spend per month on different activities in the UK?
As of 2023, the average UK student spends 40% of their time at university studying. This is up from 26% in 2022. A typical student in 2023 now spends around 119 hours a month on academic work. This includes attending lectures, completing coursework, and visiting the library to study.
A breakdown of the average number of hours spent each month on various activities by UK university students
| Activity | Average number of hours spent per month (2022) | Average number of hours spent per month (2023) |
|---|---|---|
|
Academic studying (i.e. lectures, coursework, library)
|
84
|
119
|
|
Going out (i.e. socialising)
|
71
|
55
|
|
Hobbies
|
63
|
41
|
|
Home entertainment (i.e. gaming, online activities)
|
57
|
58
|
|
Part-time work
|
43
|
18
|
Between 2022 and 2023, the average number of hours spent in part-time work decreased by around 57%, from 43.16 hours per month to 18.3.
In addition to this, the number of hours students spend on streaming services averaged at 35.86 per month compared to 16.5 in 2022. This means that students now spend more time in 2023 streaming TV than going out with friends (approximately 30 hours per month).
When broken down by university:
- Those in Bristol, Coventry, and Portsmouth spend the most amount of time each month in part-time work (all averaging over 24 hours per month).
- The overall percentage of students with part-time jobs decreased from 46% to 42% between 2022 and 2023.
- Students studying at Oxford spend more time studying on campus than any other university (126.91 per month).
UK student contents insurance survey (2023)
Between 7-14 August 2023, we surveyed 2,000 adults with an undergraduate degree, who lived in private accommodation during their 2nd, 3rd, or 4th year of university.
The aim was to find out their experiences of student contents insurance while at university.
Our main findings show that:
- A quarter (25%) had possessions stolen while living in private accommodation at uni
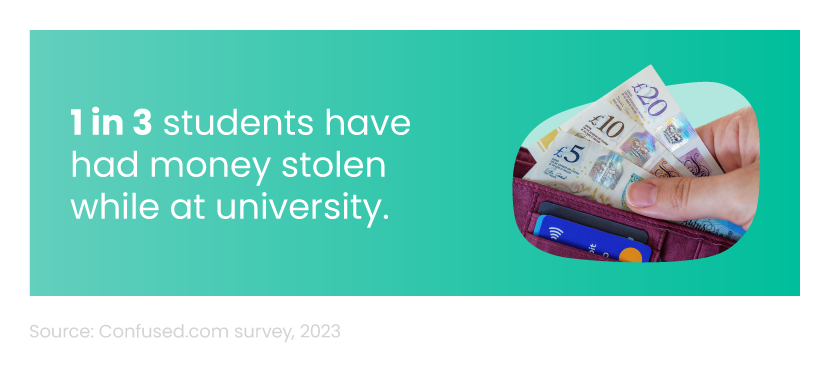
- The most commonly stolen item from students was money (33%)
- Almost 6 in 10 students (59%) didn’t have contents insurance while at uni
- Half of students (50%) wished they had taken out contents insurance in order to receive financial compensation for stolen items
- Over half (52%) didn’t know what contents insurance was when they went to university
Before taking out student contents insurance, it’s worth using a contents calculator, to work out the estimated cost of your items and get the policy that is right for you.
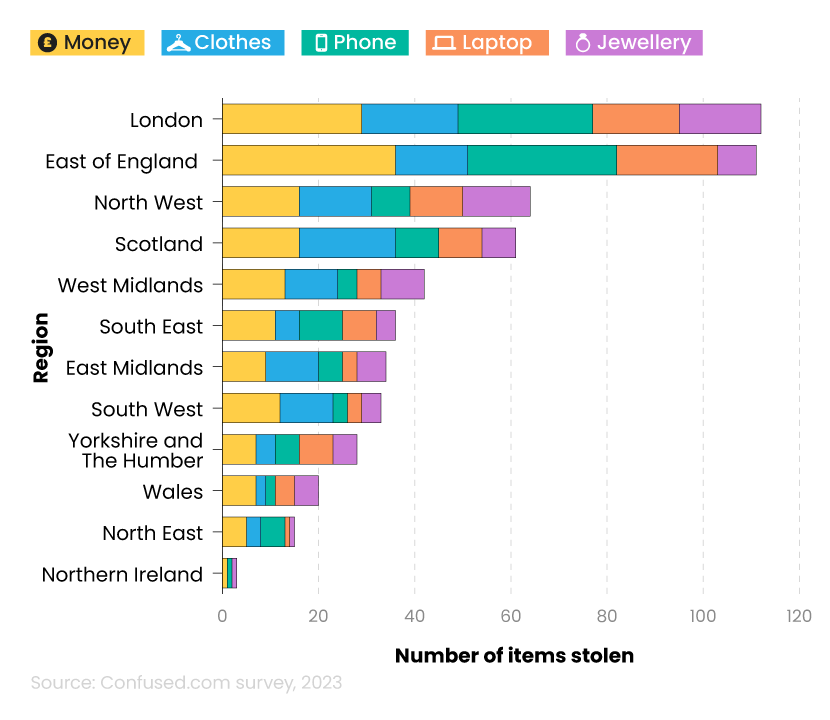
Most commonly stolen items at university
A third (33%) of students surveyed claim to have had money stolen from them while at university.
This is followed by:
- Almost a quarter of students (24%) who have had clothes stolen
- More than a fifth (22%) who have been victims of phone theft at university
A breakdown of most commonly stolen items for university students
| Item | Percentage of students who had this item stolen |
|---|---|
|
Money
|
33%
|
|
Clothes
|
24%
|
|
Phone
|
22%
|
|
Laptop
|
18%
|
|
Textbooks
|
16%
|
|
Jewellery
|
16%
|
|
Tablet / iPad
|
15%
|
|
Bike
|
14%
|
|
Camera
|
13%
|
|
Sports equipment
|
10%
|
|
Speakers
|
10%
|
|
Scooter
|
7%
|
|
Musical instrument
|
7%
|
|
Montior
|
7%
|
|
Other
|
14%
|
|
Can't remember
|
3%
|
Around 1 in 5 students (18%) admit to having a laptop stolen over the course of their study, with slightly less reporting the theft of textbooks and jewellery (both 16%).
For more information, check out our guide on how to keep your possessions covered in shared accommodation while at university.
Most common reasons for not taking out student contents insurance
According to our survey, almost 3 in 5 students (59%) don’t have contents insurance while at university.
A breakdown of the main reasons why students didn’t choose contents insurance while at university
| Reason | Percentage of students who selected this response | Number of respondents |
|---|---|---|
|
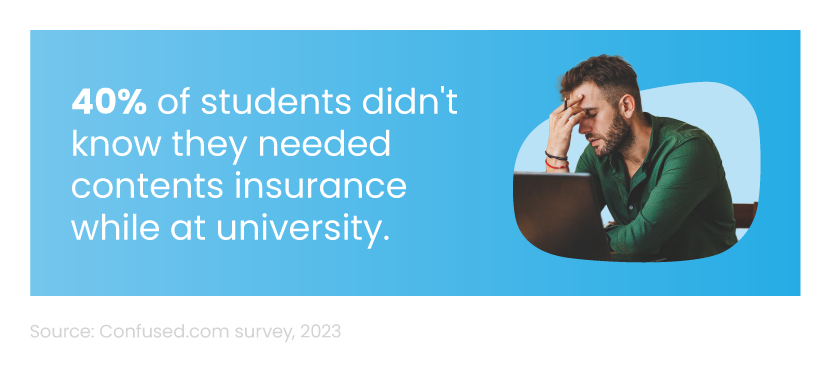
I didn't know I needed it
|
40%
|
474
|
|
I didn't feel the need to protect my things
|
32%
|
377
|
|
It was too expensive
|
28%
|
328
|
|
I didn't know I could get a student contents insurance policy
|
28%
|
326
|
|
I didn't know where to buy it
|
12%
|
140
|
|
Someone else in my accomodation had a policy which I thought covered me
|
7%
|
82
|
|
Other reason
|
3%
|
30
|
|
Not sure / no reason in particular
|
6%
|
69
|
|
Number of respondents
|
|
1,185
|
Of the 2,000 students surveyed, just over a quarter (26%) wished they had taken out contents insurance while at university, with two-thirds (66%) stating they didn’t.
A breakdown of the main reasons students gave for wishing they had taken out contents insurance while at university
| Percentage of students who selected this response | Number of respondents | |
|---|---|---|
|
To receive financial compensation for my possessions that were stolen
|
50%
|
153
|
|
For general peace of mind
|
33%
|
101
|
|
To receive financial compensation for my possessions that were damaged / broken
|
27%
|
83
|
|
To get new replacement items for my possessions that were stolen
|
25%
|
75
|
|
To get new replacement items for my possessions that were damaged / broken
|
24%
|
72
|
|
Other reason
|
1%
|
2
|
|
Not sure / no reason in particular
|
1%
|
3
|
|
Number of respondents
|
|
305
|
Most students take out contents insurance for financial compensation for possessions that were stolen (50%).
A third (33%) of students wanted peace of mind. Just over a quarter (27%) wanted financial compensation for possessions that were broken/damaged.
A breakdown of how many students knew what contents insurance was when they moved into private accommodation
| Response | Percentage of students who chose this response | Number of respondents |
|---|---|---|
|
Yes - I did know what it was when I moved intro private accomodation
|
48%
|
964
|
|
No - I didn't know what it was when I moved into private accommodation but I do know now
|
46%
|
912
|
|
No - I didn't know what it was when I moved into private accomodation and I still don't know
|
6%
|
124
|
|
Number of respondents
|
|
2,000
|
Fewer than half (48%) of students surveyed claimed to know what contents insurance was before they moved into private accommodation while at university.
A similar percentage (46%) claimed to not know at the time, but do now.
Student contents insurance statistics by age group
Of the 2,000 students surveyed, around a quarter (24.7%) admitted they had been a victim of theft while at university.
A breakdown of university student theft statistics by age group as to whether students were a victim of theft while at university
| Response | Number of respondents | 18-24 | 25-34 | 35-44 | 45-54 | 44-64 | 65+ |
|---|---|---|---|---|---|---|---|
|
Yes
|
494
|
86
|
190
|
135
|
60
|
17
|
6
|
|
Prefer not to say
|
3
|
0
|
1
|
1
|
1
|
0
|
0
|
|
No
|
1,438
|
149
|
364
|
440
|
230
|
136
|
119
|
|
Not sure / can't remember
|
65
|
9
|
18
|
25
|
6
|
3
|
4
|
|
Number of respondents
|
2,000
|
244
|
573
|
601
|
297
|
156
|
129
|
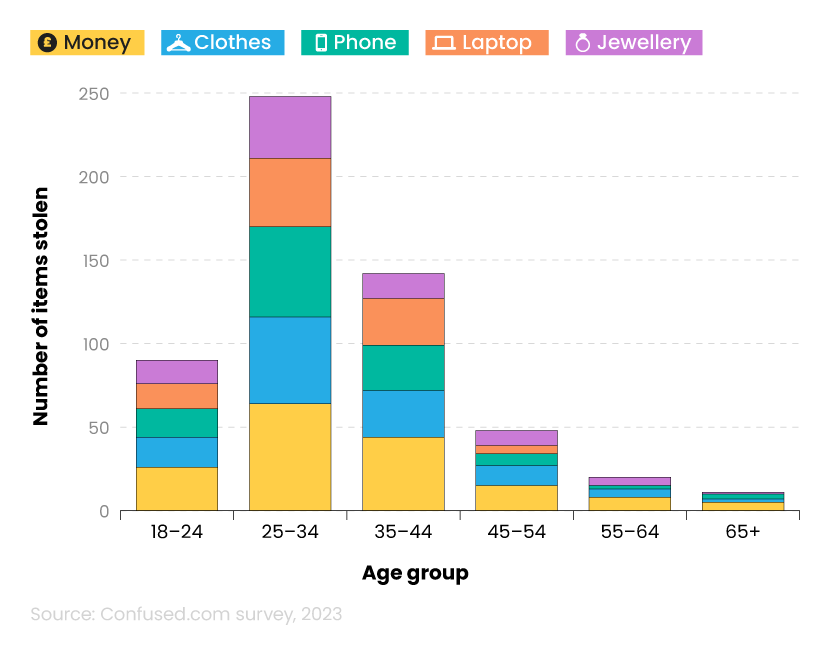
When broken down by age group, students aged 25-34 tend to report more incidents of theft than any other age group. In total, of the 494 reported thefts from our survey, almost 2 in 5 (38%) of those affected were from this age bracket.
Overall, there were around twice as many reported incidents of theft for those aged 25-34. This is compared to the 18-24 age bracket (38% vs 17%, respectively).
A breakdown of most commonly stolen items for university students by age group
| Item | Total number of reported thefts | 18-24 | 25-34 | 35-44 | 45-54 | 44-64 | 65+ |
|---|---|---|---|---|---|---|---|
|
Money
|
162
|
26
|
64
|
44
|
15
|
8
|
5
|
|
Clothes
|
117
|
18
|
52
|
28
|
12
|
5
|
2
|
|
Phones
|
110
|
17
|
54
|
27
|
7
|
2
|
3
|
|
Laptop
|
89
|
15
|
41
|
28
|
5
|
0
|
0
|
|
Jewellery
|
81
|
14
|
37
|
15
|
9
|
5
|
1
|
Of the five most commonly stolen items:
- 2 in 5 (40%) students aged 25-34 had money stolen, compared to around 1 in 4 (27%) for those between 35 and 44
- Less than half (44%) aged 25-34 had clothes stolen, compared to less than 1 in 4 (24%) for those 35-44 years old
A breakdown of age groups and whether they took out contents insurance as a student while at university
| Response | Number of respondents | 18-24 | 25-34 | 35-44 | 45-54 | 44-64 | 65+ |
|---|---|---|---|---|---|---|---|
|
Yes
|
635
|
99
|
190
|
184
|
101
|
41
|
20
|
|
No
|
1,185
|
129
|
339
|
359
|
169
|
97
|
91
|
|
Not sure / can't remember
|
180
|
16
|
44
|
58
|
27
|
18
|
17
|
|
Number of respondents
|
2,000
|
244
|
573
|
601
|
297
|
156
|
129
|
Overall, just over half (54%) of students surveyed took out contents insurance while at university.
Generally speaking, the younger age groups were more likely to take out contents insurance within their age group (41% of 18-24-year-olds, down to 16% of the over 65s). Naturally, there is an expected difference in these results as university students tend to be from younger age brackets.
But, of all those who did opt for contents insurance while at uni, just 16% were aged 18-24, with just under a third (30%) aged 24-35 making up the highest percentage.
Student contents insurance statistics by gender
Our survey results suggest that females are twice as likely to experience theft while at university compared to males. In total, almost two-thirds (64%) of respondents who were victims of theft at university were female, compared to around 35% who were male.
A breakdown of reported university student theft statistics by gender
| Response | Total number of respondents | Female | Male | non-binary or alternative identity |
|---|---|---|---|---|
|
Yes
|
494
|
317
|
176
|
1
|
|
Prefer not to say
|
3
|
1
|
2
|
0
|
|
No
|
1,438
|
969
|
468
|
1
|
|
Not sure / can't remember
|
65
|
50
|
15
|
0
|
|
Total number of respondents
|
2,000
|
1,337
|
661
|
2
|
Of the 5 most commonly stolen items at university, females were:
- 1.5 times more likely to report the theft of money (60% vs 40%)
- Nearly twice as likely to be victims of clothing theft (65% vs 35%)
- 1.5 times more likely to have a phone/laptop stolen than males (60% vs 40%)
- 2.5 times more likely to have jewellery stolen compared to males (72% vs 28%)
| Item | Total number of reported thefts | Female | Male | Non-binary or alternative identity |
|---|---|---|---|---|
|
Money
|
162
|
96
|
65
|
1
|
|
Clothes
|
117
|
76
|
41
|
0
|
|
Phone
|
110
|
65
|
45
|
0
|
|
Laptop
|
89
|
53
|
36
|
0
|
|
Jewellery
|
81
|
58
|
23
|
0
|
Of the 2,000 students surveyed in our study, fewer than a third (31.75%) took out contents insurance while at university.
A breakdown of genders and whether they took out contents insurance as a student while at university
| Response | Total number of respondents | Female | Male | Non-binary or alternative identity |
|---|---|---|---|---|
|
Yes
|
625
|
405
|
229
|
1
|
|
No
|
1,185
|
800
|
384
|
1
|
|
Not sure / can't remember
|
180
|
132
|
48
|
0
|
|
Number of respondents
|
2,000
|
1,337
|
661
|
2
|
When broken down by gender:
- Within the male students surveyed, 34.6% of them took out contents insurance compared to 30.3% for females.
- But, of the 635 students who did have contents insurance at university, almost two-thirds (63.8%) were female with 36.1% male.
Student contents insurance statistics by UK region
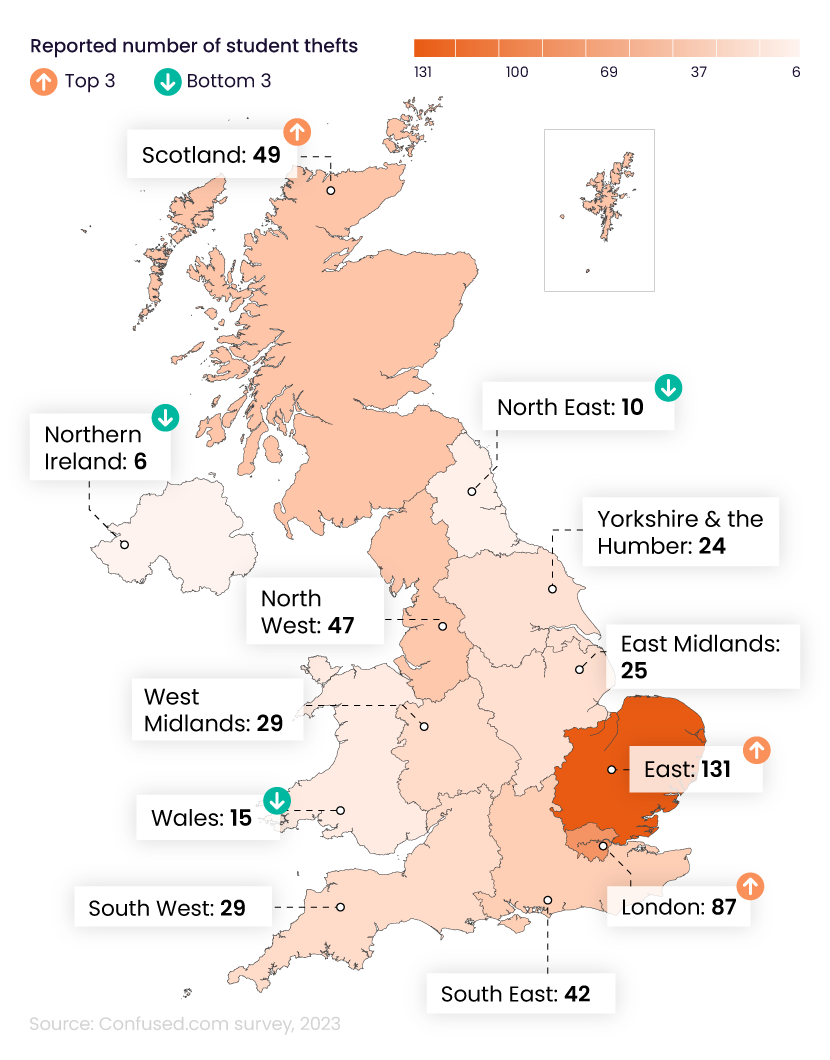
Of the 494 reported cases of theft while at university, the largest percentage came from students in the East of England (26.5%), followed by London (20%).
A breakdown of university student theft statistics by UK region
| Region | Yes | Prefer not to say | No | Not sure / can't remember | Total number of respondents |
|---|---|---|---|---|---|
|
East Midlands
|
25
|
0
|
86
|
4
|
115
|
|
East of England
|
131
|
0
|
187
|
5
|
323
|
|
London
|
87
|
0
|
295
|
9
|
391
|
|
North East
|
10
|
0
|
38
|
2
|
50
|
|
North West
|
47
|
0
|
143
|
4
|
194
|
|
Northern Ireland
|
6
|
0
|
34
|
7
|
47
|
|
Scotland
|
49
|
0
|
107
|
8
|
164
|
|
South East
|
42
|
1
|
196
|
16
|
255
|
|
South West
|
29
|
1
|
97
|
4
|
131
|
|
Wales
|
15
|
0
|
56
|
2
|
73
|
|
West Midlands
|
29
|
0
|
92
|
4
|
125
|
|
Yorkshire and The Humber
|
24
|
1
|
107
|
0
|
132
|
|
Total number of respondents
|
494
|
3
|
1,438
|
65
|
2,000
|
The fewest number of university thefts were reported in Northern Ireland (1.21%). But, these students only made up 2.35% of the total sample.
Between universities, around 2 in 5 (40.6%) students from East of England universities have experienced theft while at uni. This is almost double the amount compared to London, where reported thefts are around 1 in 5 (22.3%) students affected.
A breakdown of most commonly stolen items for university students by UK region
| Region | Money | Clothes | Phone | Laptop | Jewellery |
|---|---|---|---|---|---|
|
East Midlands
|
9
|
11
|
5
|
3
|
6
|
|
East of England
|
36
|
15
|
31
|
21
|
8
|
|
London
|
29
|
20
|
28
|
18
|
17
|
|
North East
|
5
|
3
|
5
|
1
|
1
|
|
North West
|
16
|
15
|
8
|
11
|
14
|
|
Northern Ireland
|
1
|
0
|
1
|
0
|
1
|
|
Scotland
|
16
|
20
|
9
|
9
|
7
|
|
South East
|
11
|
5
|
9
|
7
|
4
|
|
South West
|
12
|
11
|
3
|
3
|
4
|
|
Wales
|
7
|
2
|
2
|
4
|
5
|
|
West Midlands
|
13
|
11
|
4
|
5
|
9
|
|
Yorkshire and The Humber
|
7
|
4
|
5
|
7
|
5
|
|
Total number of respondents
|
162
|
117
|
110
|
89
|
81
|
With 162 reported cases, money is the most commonly stolen item across UK universities, accounting for around a third (32.8%) of all reported student thefts.
Of these, around a fifth (22.2%) came from East of England students, with 18% from those studying in London.
Our survey also shows that:
- Around a third (34%) of all clothes stolen came from either London or Scottish universities (both 17%)
- Just over a quarter (28%) of all mobile phone thefts were from those studying in the East of England
- Just under a quarter (23.6%) of all reported stolen laptops came from uni students in the East of England
- Around a fifth (21%) of all student jewellery thefts were based in the capital, followed by the North West (17.2%)
A breakdown of UK regions and whether students took out contents insurance while at university
| Region | Yes | No | Not sure / can't remember | Total number of respondents |
|---|---|---|---|---|
|
East Midlands
|
38
|
67
|
10
|
115
|
|
East of England
|
146
|
160
|
17
|
323
|
|
London
|
101
|
256
|
34
|
391
|
|
North East
|
14
|
33
|
3
|
50
|
|
North West
|
60
|
115
|
19
|
194
|
|
Northern Ireland
|
8
|
33
|
6
|
47
|
|
Scotland
|
57
|
95
|
12
|
164
|
|
South East
|
70
|
151
|
34
|
255
|
|
South West
|
43
|
77
|
11
|
131
|
|
Wales
|
20
|
48
|
5
|
73
|
|
West Midlands
|
45
|
72
|
8
|
125
|
|
Yorkshire and The Humber
|
33
|
78
|
21
|
132
|
|
Total number of respondents
|
635
|
1,185
|
180
|
2,000
|
According to our survey, students studying in the East of England are most likely to take out contents insurance while at university (45%). This was followed by those in the West Midlands (36%) and Scotland (35%).
But, fewer than a fifth (17%) of students in Northern Ireland opt for contents insurance while at university – the lowest figure across all UK regions.
UK student attitudes towards money
Data from Natwest reveals more than a third (34%) of UK students admit trying to budget while at university, but don’t always stick to it. Almost a quarter (23%) have a careful budget plan and track their finances and spending regularly.
A breakdown of student attitudes towards money while at university
| Attitude | Percentage of students (%) |
|---|---|
|
I try to budget, but don't always stick to it
|
34%
|
|
I budget carefully and keep track of what I spend
|
23%
|
|
I feel confident about budgeting and or managing money
|
21%
|
|
I don’t budget, but I am not frivolous with money
|
14%
|
|
I overspend due to pressure on missing out on things
|
5%
|
|
I don’t consider what I’m spending at all – I’ll think about it later
|
2%
|
|
I have no confidence in my ability to manage my finances
|
2%
|
A tiny percentage (2%) of students surveyed by Natwest admit to not considering their spending while at university. An equal percentage also lack the confidence to manage their finances independently.
A breakdown of how UK students rank their stress levels when it comes to money management
| Score (how students rate their stress levels when it comes to money management, with 0 being low stress and 10 being high stress) | Percentage of students (%) |
|---|---|
|
0
|
3%
|
|
1
|
2%
|
|
2
|
5%
|
|
3
|
8%
|
|
4
|
8%
|
|
5
|
14%
|
|
6
|
19%
|
|
7
|
18%
|
|
8
|
12%
|
|
9
|
6%
|
|
10
|
7%
|
When asked to rate their stress levels in terms of money management, more than a third (35%) of students provided a score of 6 or 7. This indicates some mild stress when it comes to managing their finances at university.
Twice as many students selected a score of 10 (maximum stress) compared to 0 (no stress), at 7% and 3%, respectively.
This is consistent with the Save the Student money survey, where 82% of students worry about making ends meet while at university. The 3 most common areas of life that students were impacted by their financial issues were in regard to:
- Diet (49%)
- Mental health (55%)
- Social life (62%)
A breakdown of the most and least stressed students when it comes to money management at university
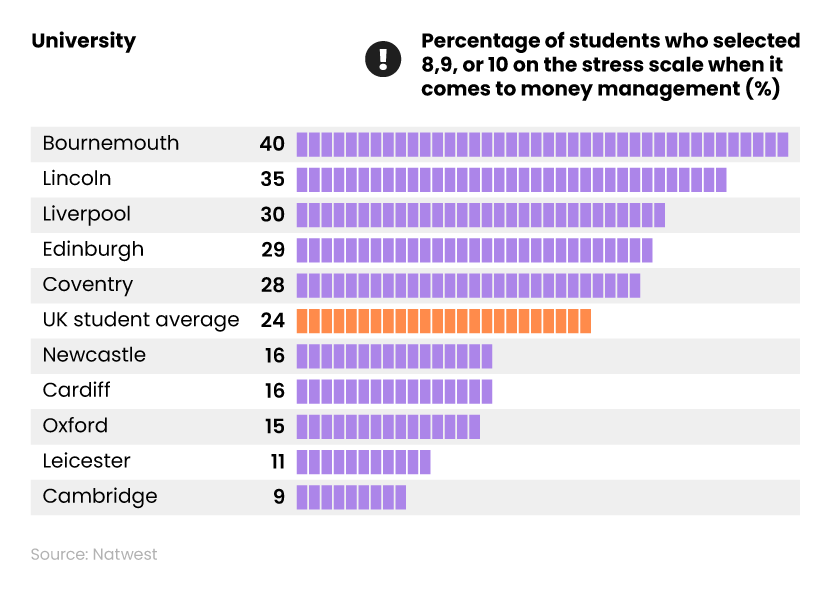
Around 1 in 4 (24%) UK students admit to finding money management stressful. This is particularly the case in Bournemouth (40%) and Lincoln (35%).
Overall, stress from managing money has increased by more than a quarter (28%) since 2022.
The Natwest survey also found that:
- Just 5% of students feel their university supports them with money management – with just 2% of those at Coventry stating a lack of financial support for students.
- Around 2 in 5 (40%) students felt their university does nothing to help with the student cost of living crisis.
- Bournemouth had the highest percentage (58%) who thought this– 45% more than the UK average figure.
A breakdown of student attitudes towards savings while at university
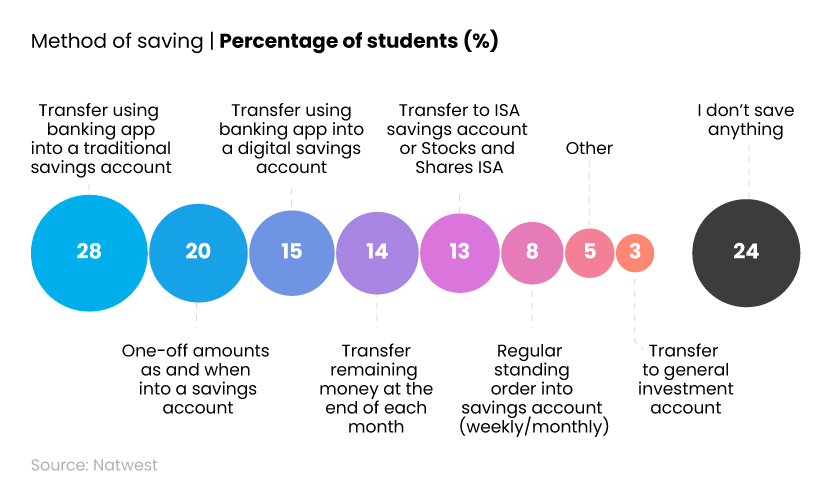
In terms of how UK students save while at university, more than a quarter (28%) will transfer money into a traditional savings account. A fifth (20%) of students admit to transferring money in one-off payments on an irregular basis.
That said, around 1 in 4 (24%) UK students claim to not save anything while at university.
A breakdown of the largest and smallest average total savings per month from UK students by university
| University | Average monthly savings per student (£) |
|---|---|
|
Cambridge
|
£250
|
|
Edinburgh
|
£150
|
|
Manchester
|
£150
|
|
UK student average
|
£100.95
|
|
Liverpool
|
£55
|
|
York
|
£50
|
|
Nottingham
|
£50
|
In 2023, the average monthly savings per student was just over £100, according to the latest Student Living Index from Natwest.
Typically, students in Cambridge save the most each month (around 1.5 times the national average) and 5 times more than students in Nottingham and York.
A breakdown of the measures taken in 2023 by UK students to reduce spending during the cost of living crisis
| Change made to lifestyle | Percentage of students who did this in 2023 (%) |
|---|---|
|
Reduced the number of times you ordered things online
|
47%
|
|
Reduced the number of nights out
|
35%
|
|
Reduced the number of meals per day
|
26%
|
|
Choose less expensive mode of transport
|
20%
|
|
Got a job
|
24%
|
|
Asked parents for more income
|
12%
|
|
Increased work hours
|
18%
|
|
Cancelled streaming subscriptions
|
12%
|
|
Reduced the amount of heating used
|
23%
|
|
I have not made any changes
|
12%
|
|
Other
|
2%
|
In light of the cost of living crisis, UK students have made a number of changes to their spending habits in 2023, with:
- Almost half (47%) reducing their frequency of online shopping
- More than a third (35%) cutting down on nights out
- More than 1 in 4 (26%) students have reduced the number of meals per day in order to save on grocery bills.
Incidentally, around 1 in 10 (12%) students haven’t made any changes to their lifestyle in order to cope with the cost of living crisis.
A breakdown of the extent to which students have felt like leaving their course due to financial pressures of university
| Response | Percentage of students (%) |
|---|---|
|
Yes, I have considered leaving, but I’ll carry on/find a way to manage
|
21%
|
|
Yes, I have considered leaving due to high cost of living
|
2%
|
|
No, I haven’t considered leaving, but it is a concern for me
|
29%
|
|
No, I have not considered leaving
|
49%
|
When surveyed by Natwest,
- Almost half (49%) of students claim that financial pressures haven’t caused them to consider leaving university early.
- Around 1 in 5 (21%) admit they have considered leaving, but will find a way to cope.
- Less than a third (29%) said they’re concerned by financial pressures while at university.
In terms of the future, 86% of students expect the cost of living crisis to rise further in the next academic year. Less than half (46%) expect a rise of up to 15% between 2023 and 2024, with a third (33%) anticipating an increase between 16% and 30% in the average student cost of living.
How the cost of living crisis is impacting the university experience of students
As a result of the stress of the increased cost of living, 3 in 10 (30%) felt that their grades suffered as a result. This is a 1% fall in comparison to 2022.
A breakdown of how money worries affect a student’s life
| Type of stress | Percentage of respondents |
|---|---|
|
Grades suffer
|
30%
|
|
Sleep suffers
|
36%
|
|
Relationships suffer
|
38%
|
|
Diet suffers
|
49%
|
|
Mental health suffers
|
55%
|
|
Social life suffers
|
62%
|
Student cost of living statistics show that close to two-fifths (38%) of students say that money worries have had a negative impact on their relationships. This is a 3% increase compared to the year before.
The cost of living crisis hurts most students. More than three-fifths (62%) saw their social life suffer. While more than half (55%) had felt their mental health deteriorate because of the stress caused by increased living costs.
Student cost of living FAQs
Does a student loan count as income?
Yes, student loans are classified as a source of non-taxable income. This means any money you receive as part of the student finance system (i.e. tuition fee and maintenance loans) will not be taxed. But, for the purposes of Universal Credit, student maintenance loans are counted as a source of income (even if you’re eligible and don’t take it).
Do students get a cost of living payment?
Yes. Cost of living support for students comes mainly in the form of student loans, grants, and/or bursaries. Some universities, educational trusts, and charities also offer financial support for students who are struggling with living costs while at university.
How much maintenance loan should students get?
The amount of maintenance loan students get depends on their household income, where they’re studying, and where they normally live. In 2024, the average maintenance loan for students was £496 per month. But, this can vary depending on where they’re studying.
What’s the household income threshold for student finance in the UK?
The household income threshold for student finance in the UK varies depending on where you’re from in the UK and where you’re studying. For example, students in England wishing to live at home while at uni, and from a household earning £58,291 get a minimum maintenance loan of £3,698. This figure rises to £4,651 for students living away from home, studying outside of London, with household earnings of at least £62,343.
Do parents' savings affect student finance in the UK?
Yes, in a way. The amount of money in your parents’ savings doesn’t directly affect the amount of money you’re eligible for. But, any interest earned from savings must be declared as unearned income.
Student finance classifies household income as any money you get from your own savings, investments, or property, like dividends or rent. It may also include your parent(s) or partner’s income, depending on who you live with at the time of applying. That said, all student finance applications are dealt with on a case-by-case basis.
Does working part-time affect student finance in the UK?
In theory, working part-time shouldn’t affect your student finance application, providing your job isn’t your only source of income. Student finance is mainly affected by your parents’ income, where you’re studying in the UK, and your residential status.
How much is student contents insurance?
According to Confused.com data, the average cost of student contents insurance in 2024 is £72 per year (based on quotes between January and March 2024).
Sources and methodology
https://www.savethestudent.org/money/surveys/student-money-survey-2023
https://www.nus.org.uk/42_of_uk_university_students_living_off_100_or_less_a_month
https://commonslibrary.parliament.uk/cost-of-living-support-for-students/
https://www.crisis.org.uk/ending-homelessness/the-cost-of-living-crisis/
https://www.statista.com/statistics/306648/inflation-rate-consumer-price-index-cpi-united-kingdom-uk
https://www.natwest.com/life-moments/students-and-graduates/student-living-index.html
https://www.savethestudent.org/accommodation/national-student-accommodation-survey-2023.html
https://www.confused.com/home-insurance/student
https://thinkstudent.co.uk/does-a-student-loan-count-as-income-in-the-uk
https://commonslibrary.parliament.uk/cost-of-living-support-for-students
Student contents insurance survey, Confused.com, 2023
A survey of 2,000 UK adults with an undergraduate degree, who lived in private accommodation while at university (either 2nd, 3rd, or 4th year). Data collected between 7-14 August 2023.