Which type of energy tariff is best for me?
When you're picking an energy tariff, the first big decision is whether to go for single fuel or dual fuel. A dual fuel tariff means you get both your gas and electricity from the same supplier. It’s easier to manage the admin and can often work out cheaper.
You can choose to get your gas and electricity from two different suppliers if you prefer - many people do. This can potentially work out cheaper as well, so it’s worth comparing.
Next up: the type of tariff. Most energy plans are either variable rate or fixed rate.
- A standard variable tariff means unit rates can go up or down depending on the market. Though they’re capped by the price cap, they’re still usually the most expensive deals on the market. However, there's usually no exit fee, so you're free to leave if you find a better deal.
- A fixed rate tariff locks in your prices for a set time – normally a minimum of 12 months. At the moment, fixed tariffs offer strong savings against other types of energy deal. They give you peace of mind, but leaving early usually means paying an exit fee.
There are other options too:
- Prepayment tariffs let you top up your meter in advance – like pay-as-you-go for energy.
- Time-of-use tariffs (like Economy 7 or EV-specific plans) charge less at night – ideal if you’re charging a car or running appliances overnight.
- And if you’re going green, renewable tariffs offer energy from more sustainable sources. Green electricity is most common, and some suppliers also offer green gas.
So whether you're after simplicity, savings, or sustainability, there's likely a tariff that fits your lifestyle.
Just make sure to compare what's out there – the right choice could save you money in the long run.
Read more about different tariff types here.
Compare gas and electricity suppliers to find our best deal in minutes


FAQs
How often do energy prices change?
Energy prices change when the price cap changes. Currently, this happens four times a year with each price cap period lasting three months. Prices can go up or down so if you’re looking to fix, it’s a good idea to see what’s happening in the market now and what’s predicted to happen in the future. This will help you make as informed a decision as possible, though the market is unpredictable and anything can happen.
Do I need to cancel my Direct Debit when I switch
Will my gas and electricity be interrupted if I switch?
No, there won’t be any interruption to your supply at any time.
Can I switch energy supplier if I owe my current supplier money?
Yes, you can switch energy supplier if you’ve been in debt for fewer than 28 days because the money you owe will be added to your final bill. If you’ve been in debt for longer, you’ll probably have to settle the debt before you’ll be able to switch.
Prepayment customers are free to switch as long as the debt is less than £500.
I'm moving home. How do I switch gas and electricity?
If you’re moving into a new place, your first task will be to take a meter reading on the day you move in so you know at what point you should be getting charged. Then find out who the supplier for the property is and compare energy to see if there’s a better deal on offer elsewhere.
What information do I need to switch energy supplier?
You should only need your address and a recent bill to switch.
Can I switch energy supplier if I rent?
Can I switch to the same energy supplier?
Yes. If you’re on a standard variable tariff but you want to switch to a fixed deal with the same supplier, you shouldn’t have any problems. If you’re on a fixed deal but have seen a better fixed deal with the same supplier, you may need to ask if you can switch because you may have to pay early exit fees.
Can I switch energy if I have a prepayment meter?
Yes, you can switch to a different prepayment tariff and/or supplier or to a credit meter if you don’t want to be on a prepayment meter anymore.
Energy guides

What is collective energy switching?
With collective switching making a comeback, is it something you should be considering when you switch your energy deal?
Average energy bills in the UK in 2025
Energy bills may be dropping, but they remain higher than they were a few years ago. How do your bills compare to the UK average and can you save? Find out here.

How to manage your energy if you rent your home
What are your rights concerning your energy usage if you rent your home? Find out what you can and can't do here.
Energy saving tips for the home
Want to find out how to save energy around the home to keep bills down? Find energy-saving tips for every room here.

What is the Cold Weather Payment?
The Cold Weather Payment is one of a number of schemes available to help with the cost of energy during winter for low-income households. Do you qualify?
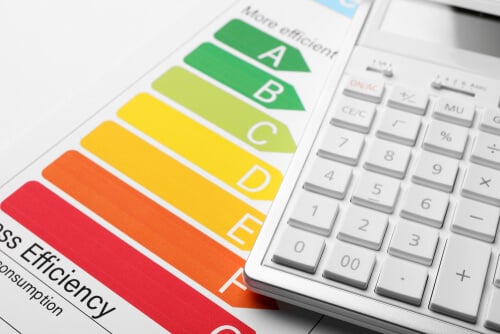
Energy Performance Certificates and ratings explained
Find out why Energy Performance Certificates are important if you want to sell or rent your home, as well as how they can help you manage your energy use.