


Entering the world of comparing mortgages as first-time buyers in the UK in 2023 is both daunting and exciting.
This guide offers a snapshot of the current landscape, including demographics of the average first-time buyer, average house prices and more.
Once you’re clued up on the latest first-time buyer statistics, compare first-time buyer mortgages here at Confused.com to get the best possible deal.
UK first-time buyer statistics - overview
- There were 362,461 first-time buyers in the UK in 2022.
- Over half (52%) of all home purchase loans in the UK in 2022 were first-time buyers.
- The South East had the most first-time buyers in 2022, with 73,588.
- The average deposit for first-time buyers in 2022 was £62,470 (21% of the average purchase price).
- The average first-time buyer in 2022 was 32 years old.
- First-time buyers are most likely to be single (45.3%) and have no children (79.1%).
- The average income of a first-time buyer in 2022 was £34,000.
- Shared ownership helped 19,386 homes be bought in 2021-22.
- In England, 325,054 homes have been purchased using Help to Buy loans valued at £20.6 billion.
What is a first-time buyer?
A first-time buyer is an individual or individuals purchasing a property for the first time, although it usually refers to those buying their first house.
First-time buyers are often eligible for special financing programs and incentives unavailable to those who previously owned a property.
For example, in the UK, first-time buyers can use a Lifetime Individual Savings Account (LISA) to buy their first home. They are also exempt from paying Stamp Duty on their first home (if it’s worth less than £425,000).
However, there are a few nuances regarding the definition of a first-time buyer. For example, if you’ve inherited a property, even though you technically have never bought a property, you still won’t be considered a first-time buyer.
The same goes if you’re lucky enough to have had your parents (or anybody else) buy a property for you.
In addition, even if you’ve never bought a property before but are buying with someone else who has, you won’t qualify as first-time buyers.
In general, first-time buyer privileges typically apply to those who have never owned property, regardless of whether it's residential or commercial and regardless of where in the world the property is located.
Regarding tax relief, such as stamp duty land tax (SDLT) in the UK, this is primarily aimed at those buying their first home for residential use, not for buy-to-let purposes. Buy-to-let investors, even if they're buying for the first time, typically don't qualify for such reliefs.
The first-time buyer mortgage market through the years
As with property in general, the first-time buyer market has been through significant fluctuations over the years due to economic, political, and social changes.
Several factors have affected the first-time buyer market condition, including property prices, government policies, interest rates, and economic stability.
In the 1980s, deregulation in the financial sector and economic growth made mortgages more accessible. Government initiatives like the 'Right to Buy' scheme further boosted the market.
The 1990s saw falling interest rates making mortgages affordable, but a housing market crash instilled a sense of caution among buyers.
The 2000s brought surging property prices, making entry harder for first-time buyers. The 2008 Global Financial Crisis tightened lending restrictions and brought down house prices, presenting further challenges.
Post-2008, stricter lending criteria and the rising property prices against stagnant wages made home ownership difficult for many. Government schemes were introduced to help, like the Help to Buy scheme in 2013.
The COVID-19 pandemic and the recent cost of living crisis have further altered the market dynamics, with house prices staying high and lacking supply.
How many first-time buyers were there by year?
In 2022, there were 362,461 first-time buyers in the UK, accounting for just over half of all home purchases in the country.
Overall, the number of first-time buyers has increased over the last decade, up from 211,920, which accounted for two-fifths of home purchases.
That number steadily increased in the following years, particularly in 2013 and 2014, with annual increases of 22% and 20%, respectively.
A slight decline of 4% in 2015 saw first-time buyers briefly fall below 300,000 again before rebounding to 328,500 in 2016.
The rate continued to rise throughout the second half of the 2010s, albeit slower, growing by 5% and 2% in 2017 and 2018.
2018 also saw the point where first-time buyers accounted for half of all home purchases for the first time.
2019 saw another slight fall, although interestingly, the share of first-time buyers slightly increased, suggesting a contraction of the overall market.
A significant decrease of 13% in 2020 was caused by the COVID-19 pandemic, with a sharp rebound of a third in 2021.
However, 2022 brought further turbulence, with a decrease of 11%, although first-time buyers held their most significant market share yet, at 52%.
First-time buyers by year
| Year | First-time buyers | Annual change | First-time buyers as % of all home purchase loans |
|---|---|---|---|
|
2012
|
211,920
|
13%
|
40%
|
|
2013
|
258,210
|
22%
|
44%
|
|
2014
|
310,280
|
20%
|
46%
|
|
2015
|
298,190
|
-4%
|
46%
|
|
2016
|
328,500
|
10%
|
48%
|
|
2017
|
345,910
|
5%
|
49%
|
|
2018
|
353,120
|
2%
|
50%
|
|
2019
|
351,260
|
-1%
|
51%
|
|
2020
|
303,980
|
-13%
|
50%
|
|
2021
|
405,320
|
33%
|
48%
|
|
2022
|
362,461
|
-11%
|
52%
|
Which area has the most first-time buyers?
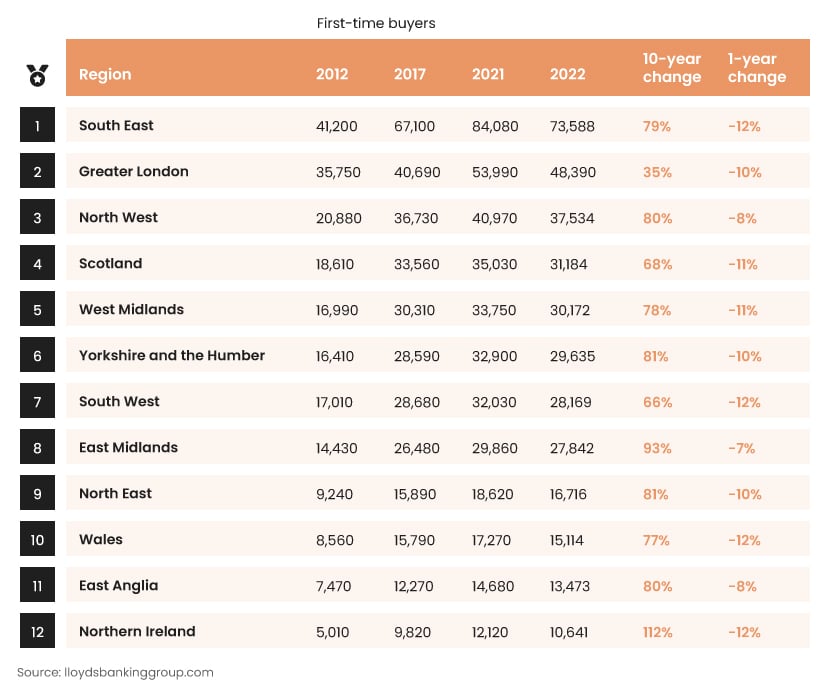
In 2022, the South East was the region where most people bought a home for the first time, with 73,588 doing so, followed by London (48,390) and the North West (37,534).
All regions experienced a drop in the number of first-time buyers, with the South East, South West, Wales and Northern Ireland all seeing a decline of 12%.
In comparison, the East Midlands showed the greatest resilience, dropping by 7% from 29,860 to 27,842.
However, if we look back over a decade, all the regions have experienced considerable growth, particularly Northern Ireland, where the number of first-time buyers more than doubled.
First-time buyers by regions
| First-time buyers | |||||||
|---|---|---|---|---|---|---|---|
| Rank | Region | 2012 | 2017 | 2021 | 2022 | 10-year change | 1-year change |
|
1
|
South East
|
41,200
|
67,100
|
84,080
|
73,588
|
79%
|
-12%
|
|
2
|
Greater London
|
35,750
|
40,690
|
53,990
|
48,390
|
35%
|
-10%
|
|
3
|
North West
|
20,880
|
36,730
|
40,970
|
37,534
|
80%
|
-8%
|
|
4
|
Scotland
|
18,610
|
33,560
|
35,030
|
31,184
|
68%
|
-11%
|
|
5
|
West Midlands
|
16,990
|
30,310
|
33,750
|
30,172
|
78%
|
-11%
|
|
6
|
Yorkshire and the Humber
|
16,410
|
28,590
|
32,900
|
29,635
|
81%
|
-10%
|
|
7
|
South West
|
17,010
|
28,680
|
32,030
|
28,169
|
66%
|
-12%
|
|
8
|
East Midlands
|
14,430
|
26,480
|
29,860
|
27,842
|
93%
|
-7%
|
|
9
|
North East
|
9,240
|
15,890
|
18,620
|
16,716
|
81%
|
-10%
|
|
10
|
Wales
|
8,560
|
15,790
|
17,270
|
15,114
|
77%
|
-12%
|
|
11
|
East Anglia
|
7,470
|
12,270
|
14,680
|
13,473
|
80%
|
-8%
|
|
12
|
Northern Ireland
|
5,010
|
9,820
|
12,120
|
10,641
|
112%
|
-12%
|
|
Average
|
United Kingdom
|
211,920
|
345,910
|
405,320
|
362,461
|
71%
|
-11%
|
Average deposit of first-time buyers
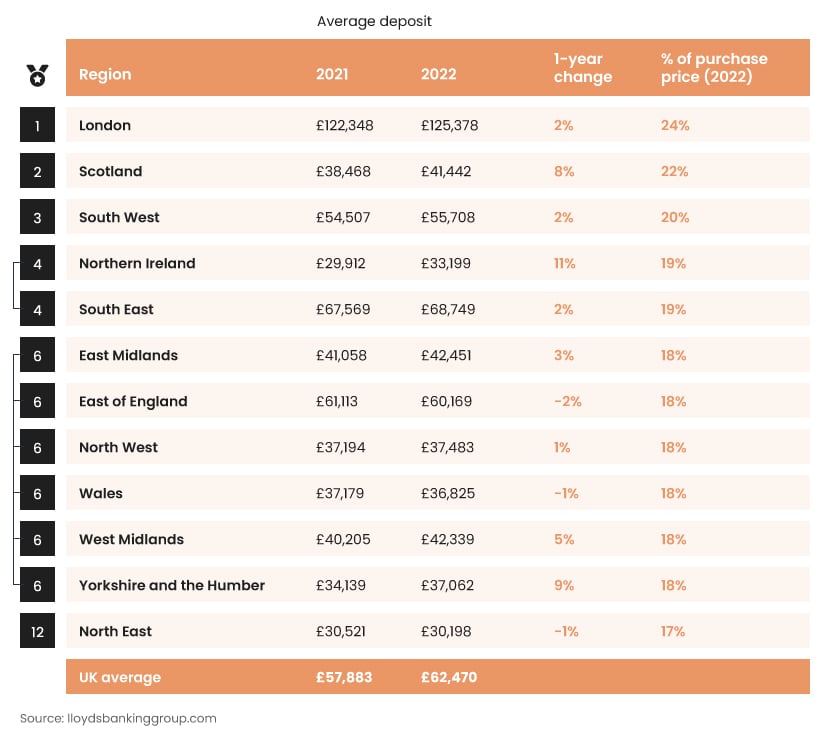
The average deposit of a first-time buyer in the UK stood at £62,470 in 2022, 21% of the average purchase price, which was £302,010.
That’s an increase of 8% compared to 2021 and reflects the overall increase in property prices in the country.
Regionally, the average deposit varies considerably. London has the highest average, at £125,378, just under a quarter of the city’s property price.
While that’s remained relatively steady since last year, Northern Ireland has seen its average deposit increase the most. The average here increased by 11%, from £29,912 to £33,199.
However, some areas saw their average deposit stay pretty steady or decline, such as the North East, Wales and the East of England.
Average first-time buyer deposit by region
| Average deposit | |||||
|---|---|---|---|---|---|
| Rank | Region | 2021 | 2022 | As % of purchase price (2022) | 1 year % change in deposit |
|
1
|
London
|
£122,348
|
£125,378
|
24%
|
2%
|
|
2
|
Scotland
|
£38,468
|
£41,442
|
22%
|
8%
|
|
3
|
South West
|
£54,507
|
£55,708
|
20%
|
2%
|
|
4
|
Northern Ireland
|
£29,912
|
£33,199
|
19%
|
11%
|
|
4
|
South East
|
£67,569
|
£68,749
|
19%
|
2%
|
|
6
|
East Midlands
|
£41,058
|
£42,451
|
18%
|
3%
|
|
6
|
East of England
|
£61,113
|
£60,169
|
18%
|
-2%
|
|
6
|
North West
|
£37,194
|
£37,483
|
18%
|
1%
|
|
6
|
Wales
|
£37,179
|
£36,825
|
18%
|
-1%
|
|
6
|
West Midlands
|
£40,205
|
£42,339
|
18%
|
5%
|
|
6
|
Yorkshire and The Humber
|
£34,139
|
£37,062
|
18%
|
9%
|
|
12
|
North East
|
£30,521
|
£30,198
|
17%
|
-1%
|
|
Average
|
United Kingdom
|
£57,883
|
£62,470
|
21%
|
8%
|
How old is the average first-time buyer?
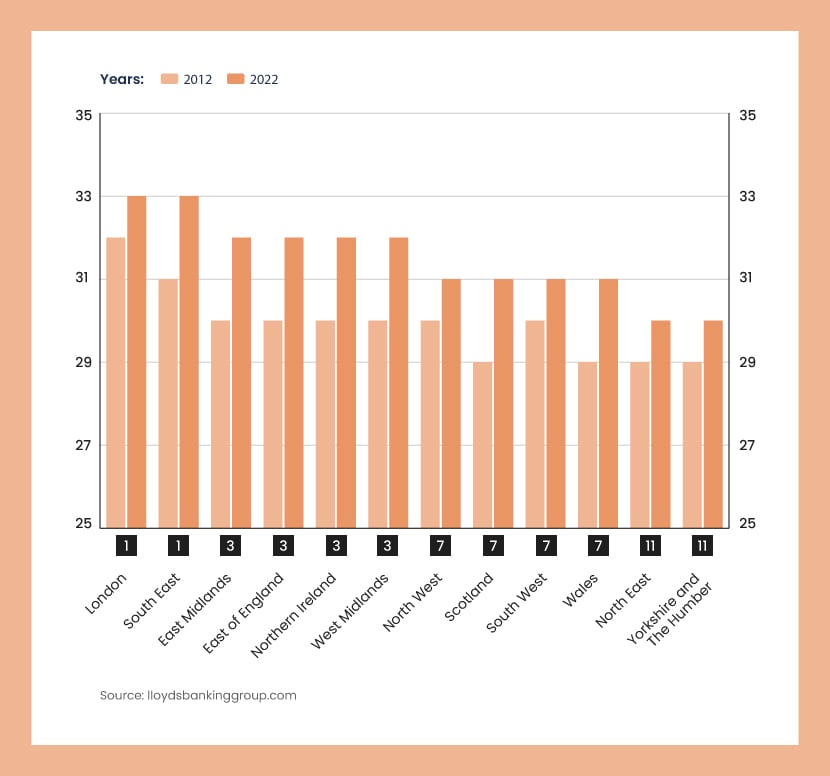
The average first-time buyer in the UK in 2022 was 32 years old, up from 30 a decade previously.
London and the South East are the regions where first-time buyers have to wait for the longest, with the average age here standing at 33.
That’s followed by the East and West Midlands, East of England and Northern Ireland, all of which match the nationwide average of 32.
The North West, Scotland, South West and Wales all have a below-average age of 31, although all have increased since 2012. Finally, the North East and Yorkshire & the Humber have the lowest average ages, 30.
| Average age | |||
|---|---|---|---|
| Rank | Region | 2012 | 2022 |
|
1
|
London
|
32
|
33
|
|
1
|
South East
|
31
|
33
|
|
3
|
East Midlands
|
30
|
32
|
|
3
|
East of England
|
30
|
32
|
|
3
|
Northern Ireland
|
30
|
32
|
|
3
|
West Midlands
|
30
|
32
|
|
7
|
North West
|
30
|
31
|
|
7
|
Scotland
|
29
|
31
|
|
7
|
South West
|
30
|
31
|
|
7
|
Wales
|
29
|
31
|
|
11
|
North East
|
29
|
30
|
|
11
|
Yorkshire and The Humber
|
29
|
30
|
|
Total
|
United Kingdom
|
30
|
32
|
Who is the average first-time buyer?
Joint or solo?
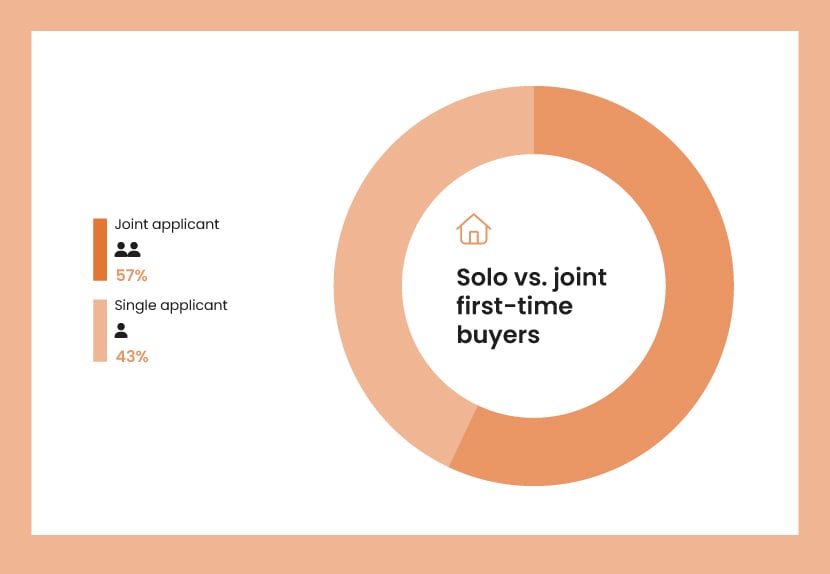
Joint applicants, usually couples or partners who are purchasing their first home together, constitute the majority of first-time home buyers.
In 2022 and 2023, joint applicants represented 57% of first-time buyers, indicating that over half of first-time buyers bought in conjunction with another person. This could perhaps be higher due to the financial advantages of having two incomes to rely on.
On the other hand, single applicants, those who applied alone for their first home purchase, represent a slightly smaller portion of the total. In the same period, they accounted for 43% of first-time buyers. While this is still a significant portion, it does lag somewhat behind the joint applicants.
| Rank | Applicant status | First-time buyers (2022 & 2023) |
|---|---|---|
|
1
|
Joint applicant
|
57%
|
|
2
|
Single applicant
|
43%
|
Solo vs. joint first-time buyers
How many children does the average first-time buyer have?
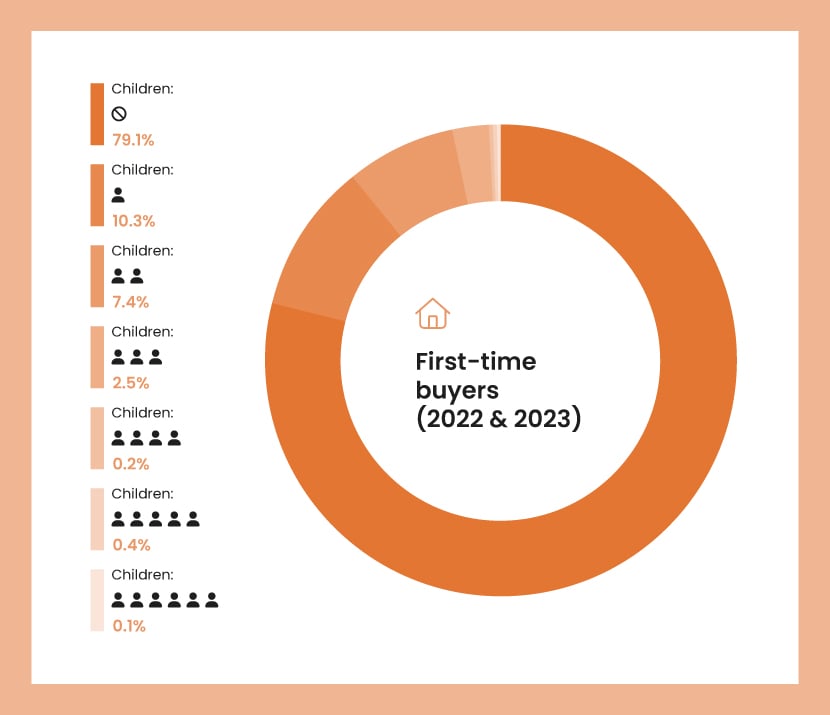
Most first-time buyers have yet to have children, with around 79% being childless when they apply.
The more children, the less likely someone is to be a first-time buyer and even those with just 1 child account for just over 1 in 10.
This suggests that most people prefer to have bought their own place before committing to having children. It’s also likely that those without children have more disposable income with which to save for a deposit.
Number of children of first-time buyers
| First-time buyers | ||
|---|---|---|
| Children | Number | Percentage |
|
0
|
1,320
|
79.1%
|
|
1
|
171
|
10.3%
|
|
2
|
124
|
7.4%
|
|
3
|
41
|
2.5%
|
|
4
|
4
|
0.2%
|
|
5
|
6
|
0.4%
|
|
6
|
2
|
0.1%
|
What is the average income of a first-time buyer?
The average first-time buyer currently earns £34,000 a year, although this has declined slightly compared to last year (£34,555).
| Year | Average income |
|---|---|
|
2022
|
£34,555
|
|
2023
|
£34,000
|
How many first-time buyers have benefited from affordable housing schemes?
Several affordable housing schemes are available in the UK to help first-time buyers get onto the property ladder.
These programs aim to make homeownership more accessible, especially to first-time buyers and those with lower incomes.
While some are aimed at those who are renting, others are designed to help you buy your first home.
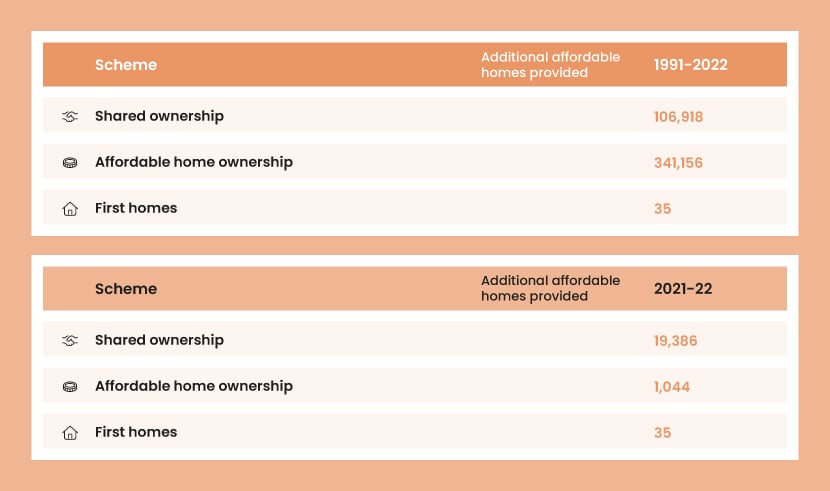
Until 2014-15, the main scheme was “affordable home ownership”, which has accounted for over 340,000 new homes since 1991.
However, since then, shared ownership has been recognised as its own scheme and has become the most popular, accounting for over 19,000 new homes in 2021-22.
The First Homes scheme only launched in June 2021, so limited data is available for these discounted homes.
Affordable homes provided to first-time buyers, by scheme
| Additional affordable homes provided | ||
|---|---|---|
| Tenure | 2021-22 | 1991-2022 |
|
Shared Ownership
|
19,386
|
106,918
|
|
Affordable Home Ownership
|
1,044
|
341,156
|
|
First Homes
|
35
|
35
|
How many first-time buyers have used Help to Buy?
The Help to Buy scheme was introduced in April 2013, with different aspects including an equity loan and a special type of ISA.
The equity loan is now only available in Wales but previously allowed you to borrow up to 20% (40% in London) of a newly built home’s cost. This means you only needed a 5% cash deposit and a 75% mortgage to make up the rest.
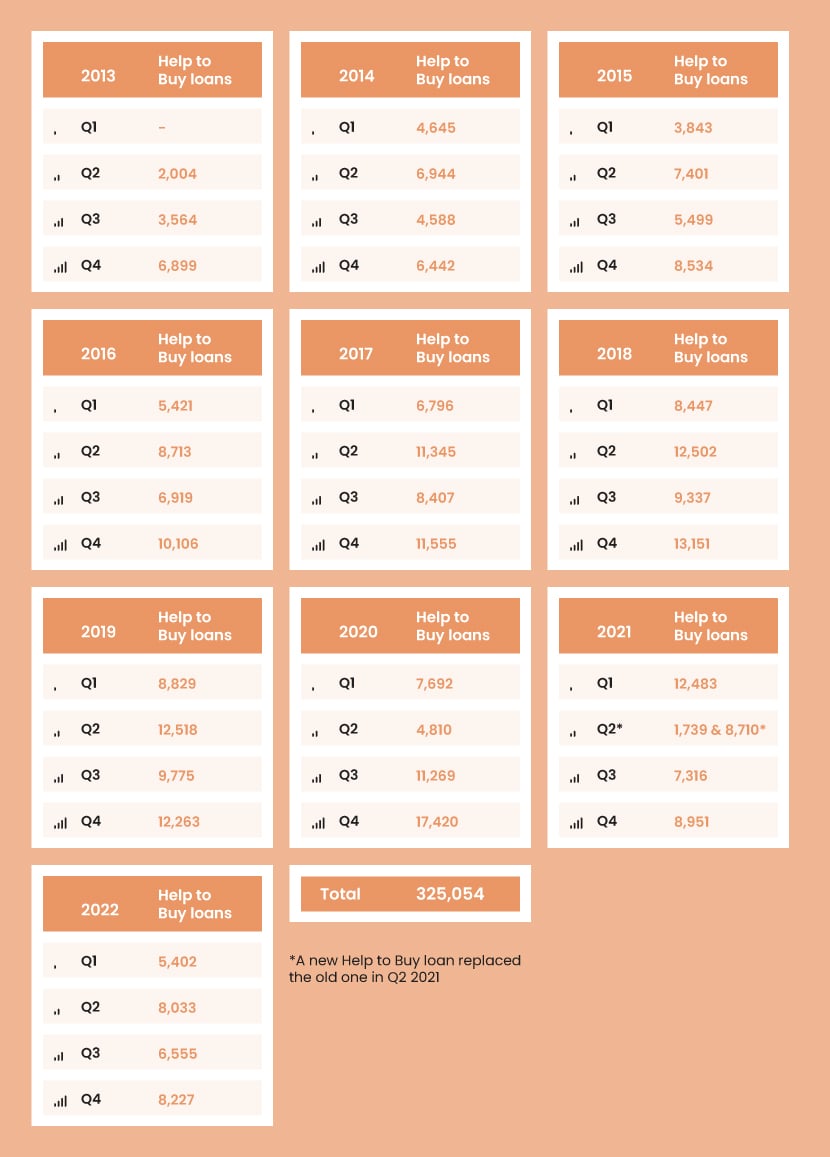
As of the end of 2022, 325,054 homes had been purchased using the equity loan in England (under both versions of the scheme).
The number of loans being used steadily increased and peaked in Q4 of 2020, when 17,420 were taken out.
Help to Buy loans by quarter
| Year | Quarter | Help to Buy loans |
|---|---|---|
|
2013
|
Q2
|
2,004
|
|
Q3
|
3,564
|
|
|
Q4
|
6,899
|
|
|
2014
|
Q1
|
4,645
|
|
Q2
|
6,944
|
|
|
Q3
|
4,588
|
|
|
Q4
|
6,442
|
|
|
2015
|
Q1
|
3,843
|
|
Q2
|
7,401
|
|
|
Q3
|
5,499
|
|
|
Q4
|
8,534
|
|
|
2016
|
Q1
|
5,421
|
|
Q2
|
8,713
|
|
|
Q3
|
6,919
|
|
|
Q4
|
10,106
|
|
|
2017
|
Q1
|
6,796
|
|
Q2
|
11,345
|
|
|
Q3
|
8,407
|
|
|
Q4
|
11,555
|
|
|
2018
|
Q1
|
8,447
|
|
Q2
|
12,502
|
|
|
Q3
|
9,337
|
|
|
Q4
|
13,151
|
|
|
2019
|
Q1
|
8,829
|
|
Q2
|
12,518
|
|
|
Q3
|
9,775
|
|
|
Q4
|
12,263
|
|
|
2020
|
Q1
|
7,692
|
|
Q2
|
4,810
|
|
|
Q3
|
11,269
|
|
|
Q4
|
17,420
|
|
|
2021
|
Q1
|
12,483
|
|
Q2
|
1,739 & 8,710*
|
|
|
Q3
|
7,316
|
|
|
Q4
|
8,951
|
|
|
2022
|
Q1
|
5,402
|
|
Q2
|
8,033
|
|
|
Q3
|
6,555
|
|
|
Q4
|
8,227
|
|
|
Total
|
325,054
|
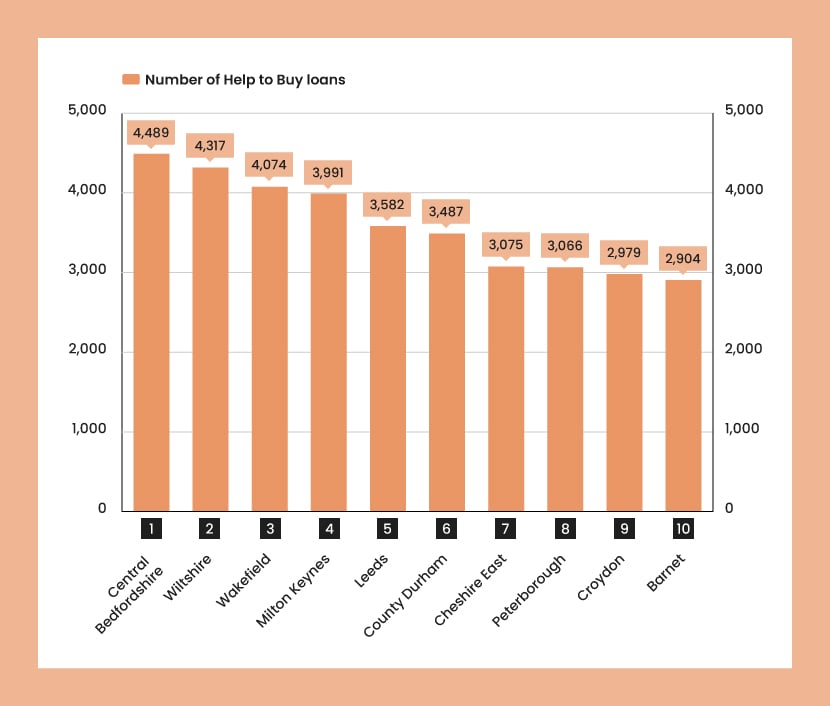
The area that has made the most use of the Help to Buy scheme is Central Bedfordshire, with just under 4,500 loans since Q2 2013. This was followed by Wiltshire, with 4,317 and Wakefield, with 4,074.
The local authorities that have made the least use of the scheme are among the most expensive in the country.
This is likely due to a cap on the price of housing that could be bought with the scheme. The caps were set regionally at 1.5 times the average forecast regional first-time buyer price, with a maximum of £600,000 in London.
Just 5 homes in the City of London have been purchased using the loan, followed by West Somerset (23) and Kensington & Chelsea (24).
Help to Buy loans by local authority
| Rank | Local authority | Help to Buy loans |
|---|---|---|
|
1
|
Central Bedfordshire
|
4,489
|
|
2
|
Wiltshire
|
4,317
|
|
3
|
Wakefield
|
4,074
|
|
4
|
Milton Keynes
|
3,991
|
|
5
|
Leeds
|
3,582
|
|
6
|
County Durham
|
3,487
|
|
7
|
Cheshire East
|
3,075
|
|
8
|
Peterborough
|
3,066
|
|
9
|
Croydon
|
2,979
|
|
10
|
Barnet
|
2,904
|
How much have first-time buyers borrowed using Help to Buy?
Since Q2 2013, £21 billion has been borrowed through the Help to Buy equity loan.
The amount paid out per quarter has increased significantly, despite some fluctuations, from £73 million in Q2 2013 to £689 million in Q4 2022.
Help to Buy loans value by quarter

| Year | Quarter | Value of Help to Buy loans |
|---|---|---|
|
2013
|
Q2
|
£73m
|
|
Q3
|
£137m
|
|
|
Q4
|
£275m
|
|
|
2014
|
Q1
|
£186m
|
|
Q2
|
£285m
|
|
|
Q3
|
£189m
|
|
|
Q4
|
£269m
|
|
|
2015
|
Q1
|
£159m
|
|
Q2
|
£324m
|
|
|
Q3
|
£243m
|
|
|
Q4
|
£387m
|
|
|
2016
|
Q1
|
£252m
|
|
Q2
|
£460m
|
|
|
Q3
|
£376m
|
|
|
Q4
|
£578m
|
|
|
2017
|
Q1
|
£416m
|
|
Q2
|
£712m
|
|
|
Q3
|
£541m
|
|
|
Q4
|
£719m
|
|
|
2018
|
Q1
|
£551m
|
|
Q2
|
£805m
|
|
|
Q3
|
£639m
|
|
|
Q4
|
£869m
|
|
|
2019
|
Q1
|
£636m
|
|
Q2
|
£842m
|
|
|
Q3
|
£716m
|
|
|
Q4
|
£819m
|
|
|
2020
|
Q1
|
£570m
|
|
Q2
|
£346m
|
|
|
Q3
|
£806m
|
|
|
Q4
|
£1bn
|
|
|
2021
|
Q1
|
£942m
|
|
Q2
|
£151m
|
|
|
Q3
|
£504m
|
|
|
Q4
|
£608m
|
|
|
2022
|
Q1
|
£449m
|
|
Q2
|
£613m
|
|
|
Q3
|
£564m
|
|
|
Q4
|
£689m
|
|
|
Total
|
£21bn
|
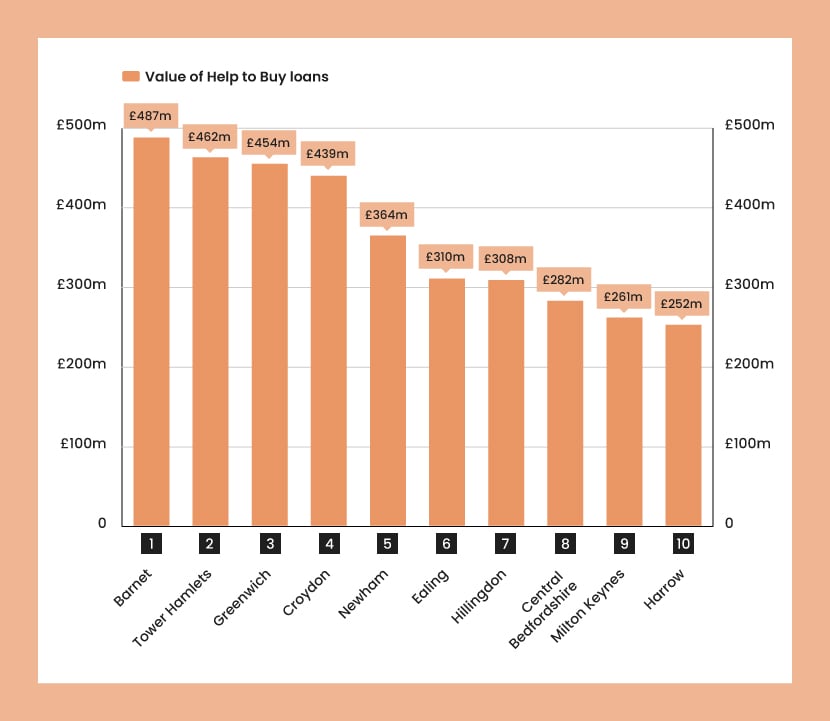
Interestingly, each of the 10 areas that have borrowed the most from the Help to Buy loan is located in the South. The majority are in London, except Central Bedfordshire and Milton Keynes.
In areas where the housing market is particularly strong, and house prices are high such as these, the demand for HTB loans is likely to be greater. This is because even the lower end of the property market might be out of reach for many people without this kind of assistance. However, while being higher than average, house prices in these areas likely fall under the Help to Buy price caps.
Barnet has borrowed the most, over £487 million. This is followed by 2 more London boroughs, Tower Hamlets (£462 million) and Greenwich (£454 million).
The only local authority to have borrowed less than £1 million from the scheme is West Somerset (£970,083), followed by the City of London £1.1 million.
Value of Help to Buy loans by local authority
| Rank | Local authority | Value of Help to Buy loans |
|---|---|---|
|
1
|
Barnet
|
£487m
|
|
2
|
Tower Hamlets
|
£462m
|
|
3
|
Greenwich
|
£454m
|
|
4
|
Croydon
|
£439m
|
|
5
|
Newham
|
£364m
|
|
6
|
Ealing
|
£310m
|
|
7
|
Hillingdon
|
£308m
|
|
8
|
Central Bedfordshire
|
£282m
|
|
9
|
Milton Keynes
|
£261m
|
|
10
|
Harrow
|
£252m
|
How many first-time buyers have used Right to Buy?
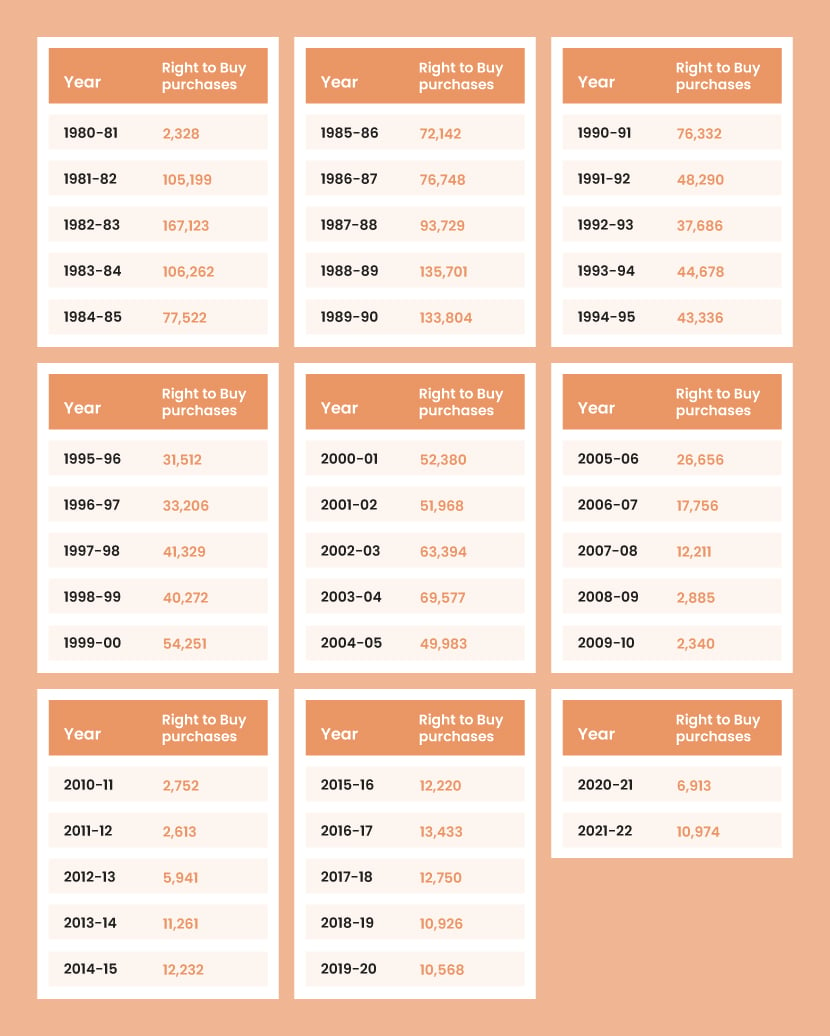
Another scheme that has benefitted some first-time buyers is Right to Buy. Right to Buy is a policy introduced in the 1980s to enable public sector tenants to purchase their homes at a discounted price. It has since been abolished in Scotland and Wales but still exists in England.
Since 1980-81, 1.8 million council homes in England have been bought through the scheme.
The initial years of the scheme saw a surge of first-time buyers taking advantage of it, peaking in 1982-83 with 167,123.
The number of people using the scheme remained relatively high throughout the 1980s before declining in the 1990s.
Use of the scheme hit its lowest point in 2009-10, with 2,340, possibly due to the global financial crisis.
However, there has been a slight revival in recent years, with 10,974 in the most recent year available (2021-22).
Right to Buy purchases by year
| Year | Right to Buy purchases |
|---|---|
|
1980-81
|
2,328
|
|
1981-82
|
105,199
|
|
1982-83
|
167,123
|
|
1983-84
|
106,262
|
|
1984-85
|
77,522
|
|
1985-86
|
72,142
|
|
1986-87
|
76,748
|
|
1987-88
|
93,729
|
|
1988-89
|
135,701
|
|
1989-90
|
133,804
|
|
1990-91
|
76,332
|
|
1991-92
|
48,290
|
|
1992-93
|
37,686
|
|
1993-94
|
44,678
|
|
1994-95
|
43,336
|
|
1995-96
|
31,512
|
|
1996-97
|
33,206
|
|
1997-98
|
41,329
|
|
1998-99
|
40,272
|
|
1999-00
|
54,251
|
|
2000-01
|
52,380
|
|
2001-02
|
51,968
|
|
2001-02
|
51,968
|
|
2002-03
|
63,394
|
|
2003-04
|
69,577
|
|
2004-05
|
49,983
|
|
2005-06
|
26,656
|
|
2006-07
|
17,756
|
|
2007-08
|
12,211
|
|
2008-09
|
2,885
|
|
2009-10
|
2,340
|
|
2010-11
|
2,752
|
|
2011-12
|
2,613
|
|
2012-13
|
5,941
|
|
2013-14
|
11,261
|
|
2014-15
|
12,232
|
|
2015-16
|
12,220
|
|
2016-17
|
13,433
|
|
2017-18
|
12,750
|
|
2018-19
|
10,926
|
|
2019-20
|
10,568
|
|
2020-21
|
6,913
|
|
2021-22
|
10,974
|
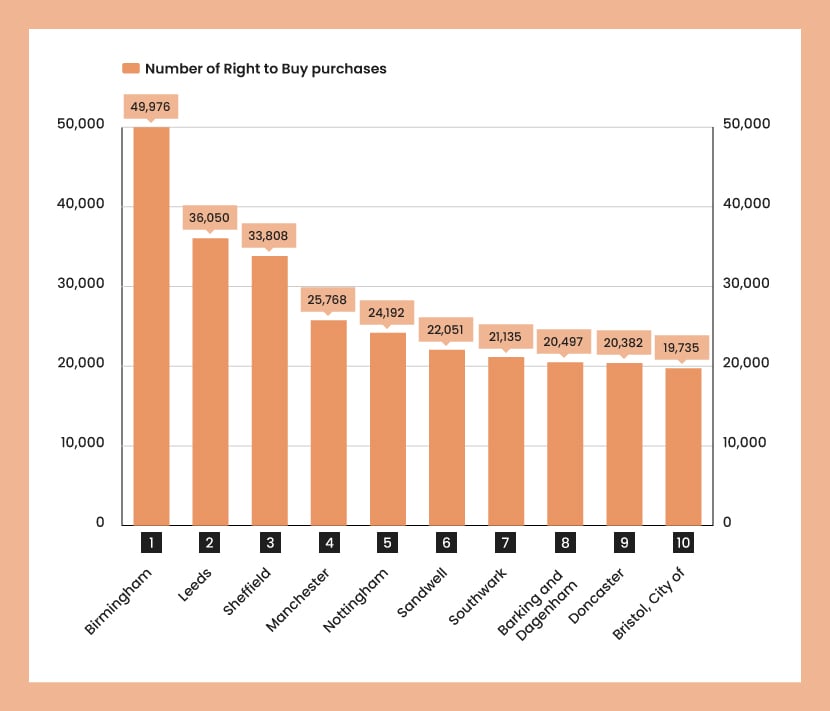
Birmingham is the local authority that has benefitted from Right to Buy the most, with just under 50,000 homes being purchased since the scheme began. This is followed by Leeds (36,050), Sheffield (33,808) and Manchester (25,768).
Right to Buy purchases by local authority
| Rank | Local authority | Right to Buy purchases |
|---|---|---|
|
1
|
Birmingham
|
49,976
|
|
2
|
Leeds
|
36,050
|
|
3
|
Sheffield
|
33,808
|
|
4
|
Manchester
|
25,768
|
|
5
|
Nottingham
|
24,192
|
|
6
|
Sandwell
|
22,051
|
|
7
|
Southwark
|
21,135
|
|
8
|
Barking and Dagenham
|
20,497
|
|
9
|
Doncaster
|
20,382
|
|
10
|
Bristol, City of
|
19,735
|
Where are homes most affordable for first-time buyers?
Getting onto the property ladder is more challenging than ever before, with house prices rising and wages struggling to keep up.
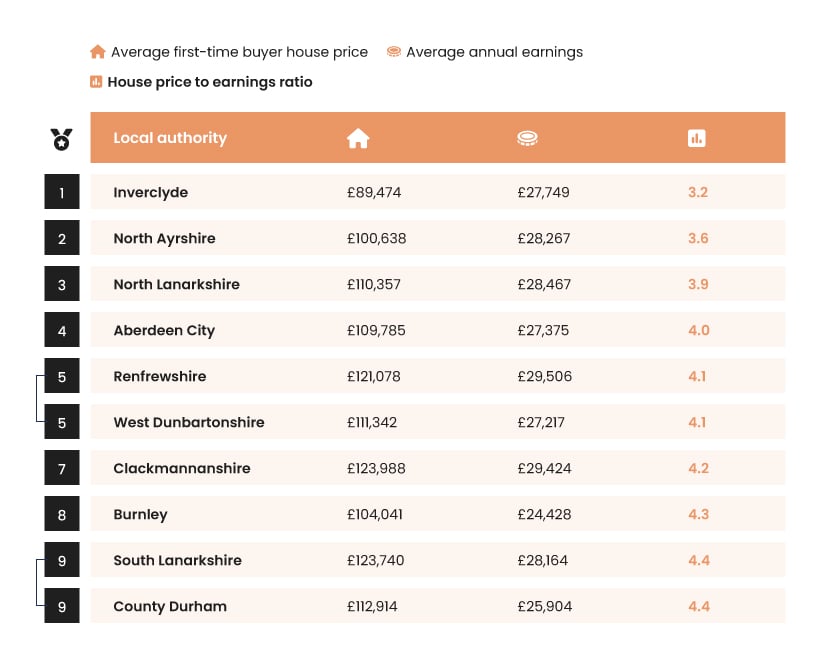
Look at the ratio of house prices to earnings; most of the country’s most affordable locations are in Scotland.
Inverclyde, in the central Lowlands of Scotland, has the smallest house price-to-earnings ratio. Here, average annual earnings are £27,749, 3.2 times less than the average first-time buyer house price of just £89,474.
The most affordable area in England is Burnley, where the average house price is £104,041, and the average earnings are £24,428, a ratio of 4.3.
Unsurprisingly, the areas where first-time buyers struggle the most to get onto the property ladder are all in London.
The least affordable overall by far is Kensington and Chelsea, with a ratio of 30.1. The area has a high average income of £37,578, but that doesn’t offset the enormous average first-time buyer price of £1,129,349.
Average first-time buyer house price to earnings ratio by local authority
| Rank | Local authority | Average first-time buyer house price | Average annual earnings | House price to earnings ratio |
|---|---|---|---|---|
|
1
|
Inverclyde
|
£89,474
|
£27,749
|
3.2
|
|
2
|
North Ayrshire
|
£100,638
|
£28,267
|
3.6
|
|
3
|
North Lanarkshire
|
£110,357
|
£28,467
|
3.9
|
|
4
|
Aberdeen City
|
£109,785
|
£27,375
|
4.0
|
|
5
|
Renfrewshire
|
£121,078
|
£29,506
|
4.1
|
|
5
|
West Dunbartonshire
|
£111,342
|
£27,217
|
4.1
|
|
7
|
Clackmannanshire
|
£123,988
|
£29,424
|
4.2
|
|
8
|
Burnley
|
£104,041
|
£24,428
|
4.3
|
|
9
|
South Lanarkshire
|
£123,740
|
£28,164
|
4.4
|
|
9
|
County Durham
|
£112,914
|
£25,904
|
4.4
|
Methodology
The number of first-time buyers by year and region, the average first-time buyer deposits and the average age of first-time buyers were all sourced from Halifax.
The numbers of first-time buyers by joint or solo, number of children, joint or solo application and income were sourced from the number of quotes provided to users by Confused.com.
The number of homes purchased by type of scheme were sourced from the Department for Levelling Up, Housing and Communities and the Ministry of Housing, Communities & Local Government’s live tables on affordable housing supply (Table 1000: additional affordable homes provided by type of scheme, England).
The number and value of homes purchased using the Help to Buy equity loan were sourced from the Department for Levelling Up, Housing and Communities and the Ministry of Housing, Communities & Local Government’s Help to Buy: equity loan statistics (31 December 2022).
The number of homes purchased using Right to Buy was sourced from the Department for Levelling Up, Housing and Communities and the Ministry of Housing, Communities & Local Government’s live tables on social housing sales (Table 691 annual: Right to Buy sales, by local authority).
House price-to-earnings ratios were calculated by dividing the average first-time buyer house price (sourced from HM Land Registry’s UK House Price Index: data downloads March 2023 by the average annual earnings (sourced from the Office for National Statistics’ ASHE Table 1: Earnings and hours worked, all employees).