


This guide provides the latest 2023 statistics to illustrate the current buy-to-let landscape. Equipped with knowledge, you can compare buy-to-let mortgages at Confused.com, ensuring you secure the best possible deal for your circumstances.

UK buy-to-let mortgages - overview
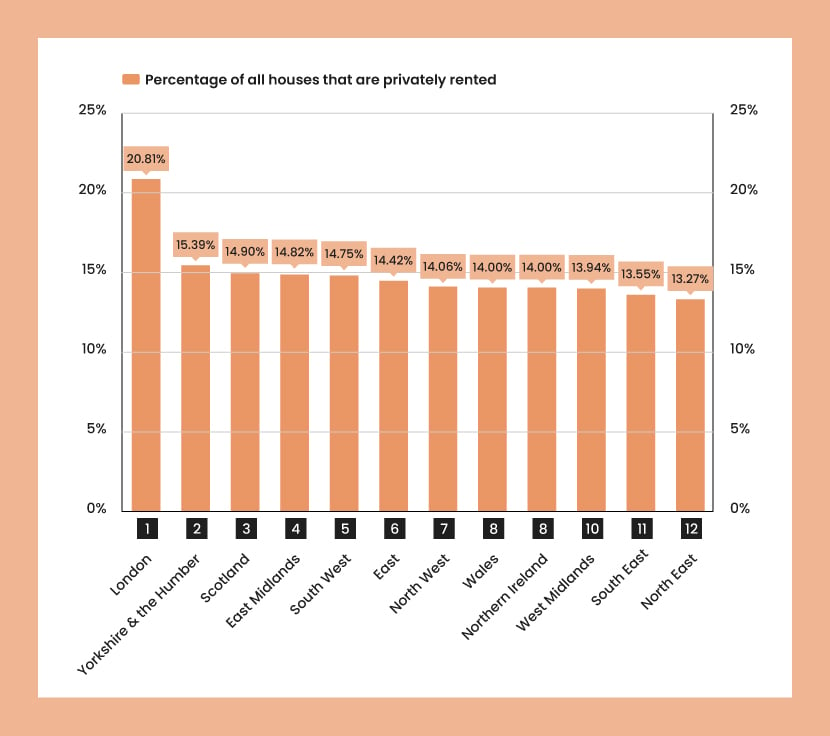
- According to government data from the four nations of the UK, 15.29% of homes in England are privately rented, with 14.9% in Scotland and 14% in Wales and Northern Ireland. London has the most rented homes, with 20.81%. The North East has the least, with 13.27%.
- As of 2022, the total value of the buy-to-let mortgage market stood at £41.3 billion, according to the Financial Conduct Authority. The market has grown by 88% compared to 2013.
- Blackpool has the smallest rent-to-house price ratio, at 1:237, while the Cotswolds has the biggest, at 1:538. The rent-to-house price ratio is calculated by dividing the average house price (from the UK House Price Index) by the average monthly rent (from the ONS).
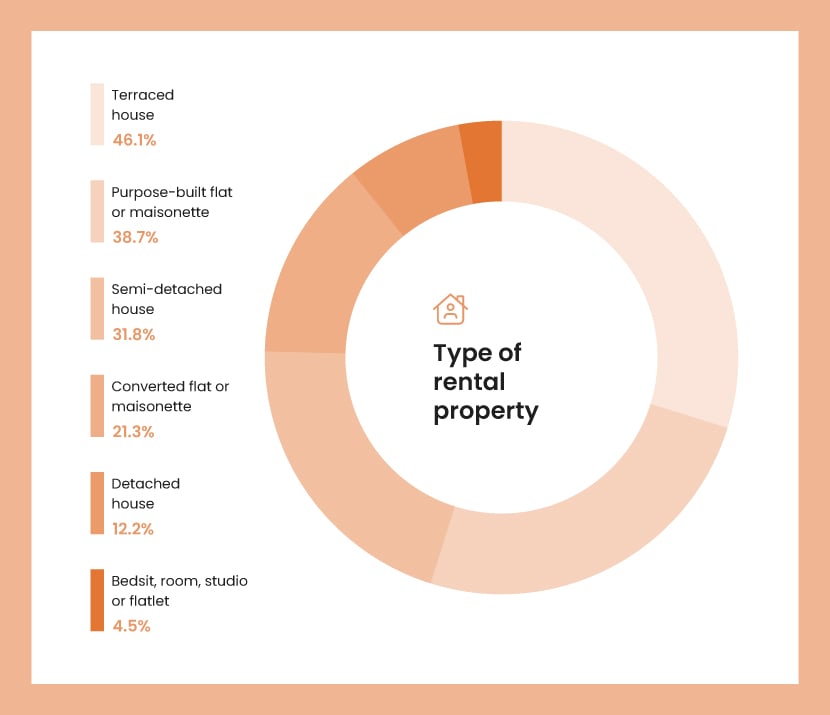
- According to the Department for Levelling Up, Housing and Communities, most rental properties are terraced houses (46.1%) or purpose-built flats or maisonettes (38.7%).
- Over the next 2 years, most landlords plan to keep their number of properties the same. Many who want to decrease their portfolio or leave the sector attribute their decision to recent (54.9%) and forthcoming (52.8%) legislative changes.
- For both new and existing tenancies, more landlords increased the rent (45.5% and 26.4%, respectively) than those who kept the rent the same or decreased it.
- Compliance with legal requirements is high, with smoke alarms on each floor in 98.8% of properties and electrical installation checks by a qualified tester in 91.4% of cases.
What percentage of UK properties are rentals?
Housing data isn’t available for the UK as a whole, but in terms of its countries, England has the highest percentage of rented properties. Here, 15.29% of all homes are privately rented, compared to 14.9% in Scotland and 14% in Wales and Northern Ireland.
The picture varies around the UK, though. For example, London has considerably more rented properties – just over a fifth. This could reflect the city's high numbers of young professionals and students who might rent rather than buy a home due to the city's high property prices. It also aligns with the generally high demand for rental properties in urban areas.
Yorkshire and the Humber comes in second, with 15.39% of its properties being privately rented, closely followed by Scotland (14.9%) and East Midlands (14.82%).
The West Midlands is third from bottom with 13.94%, followed by the South East with 13.55%, and finally, the North East with 13.27% of all houses privately rented.
| Rank | Location | Percentage of all houses that are privately rented |
|---|---|---|
|
1
|
London
|
20.81%
|
|
2
|
Yorkshire and the Humber
|
15.39%
|
|
3
|
Scotland
|
14.90%
|
|
4
|
East Midlands
|
14.82%
|
|
5
|
South West
|
14.75%
|
|
6
|
East
|
14.42%
|
|
7
|
North West
|
14.06%
|
|
8
|
Wales
|
14%
|
|
8
|
Northern Ireland
|
14%
|
|
10
|
West Midlands
|
13.94%
|
|
11
|
South East
|
13.55%
|
|
12
|
North East
|
13.27%
|
What percentage of UK mortgages are buy-to-let?
As of 2022, the total gross advances (new mortgage loans given to borrowers) amounted to £322.5 billion. Of this total, buy-to-let mortgages made up 12.8%.
While that’s significant, most of the mortgage market is still dominated by mortgages for owner-occupied properties – this makes up over three quarters (87.2%).
The actual value of the buy-to-let mortgages equates to approximately £41.3 billion, showing a significant level of investment in buy-to-let.
The buy-to-let mortgage market size through the years
The size of the buy-to-let mortgage market has steadily increased over the last decade.
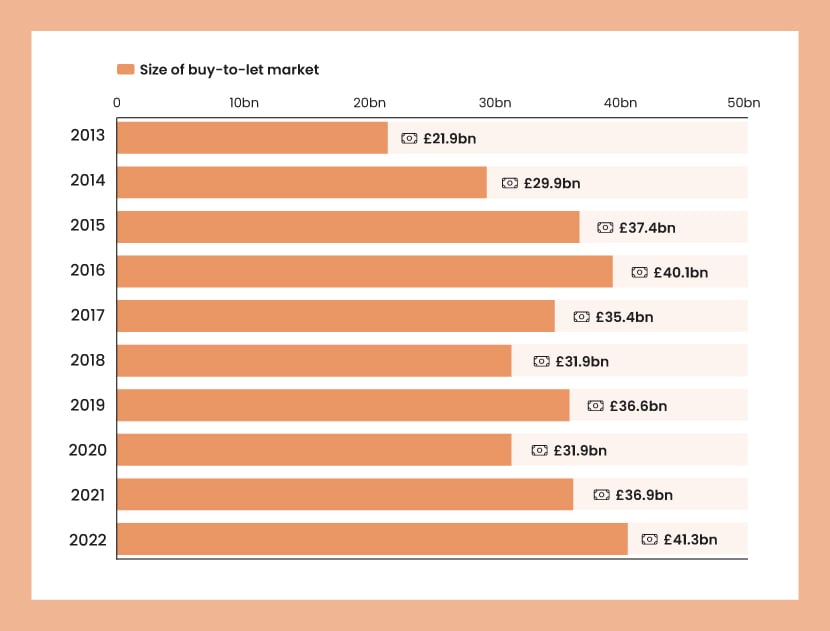
Standing at £21.9 billion in 2013, the buy-to-let market increased steadily before hitting £40.1 billion in 2016.
This was a busy time for the buy-to-let industry, with high demand as the market bounced back from the 2008 financial crisis.
However, the market saw a downturn in the second half of the decade as the government introduced steps to reduce investment attractiveness in buy-to-let. These included increased Stamp Duty, phasing out mortgage interest relief, and changes to the 10% wear and tear tax allowance. The total size of the buy-to-let market dropped to £35.4 billion in 2017, then shrank to £31.9 billion in 2018.
In 2019, the buy-to-let market rebounded to £36.6 billion, suggesting a resurgence in buy-to-let investments. However, 2020 saw another decline, bringing the market size down to £31.9 billion. This dip was mainly due to the economic impact of the Covid-19 pandemic, which affected investment decisions and the property market more broadly.
The market recovered in 2021 and reached £36.9 billion, continuing to grow into 2022, when it exceeded its previous peak from 2016, reaching £41.3 billion. This reflects a broader bounce-back as the effects of the pandemic eased and investor confidence grew.
| Year | Size of buy-to-let market |
|---|---|
|
2013
|
£21.9bn
|
|
2014
|
£29.9bn
|
|
2015
|
£37.4bn
|
|
2016
|
£40.1bn
|
|
2017
|
£35.4bn
|
|
2018
|
£31.9bn
|
|
2019
|
£36.6bn
|
|
2020
|
£31.9bn
|
|
2021
|
£36.9bn
|
|
2022
|
£41.3bn
|
Average buy-to-let mortgage deposit
According to MoneyHelper, the average buy-to-let mortgage should have a loan-to-value ratio (LTV) limit of at least 75%. This means you need a minimum 25% deposit for a buy-to-let mortgage.
Using the UK average house price of £286,489, the average buy-to-let deposit would be around £71,622.
Landlord statistics
Profile of private landlords in England
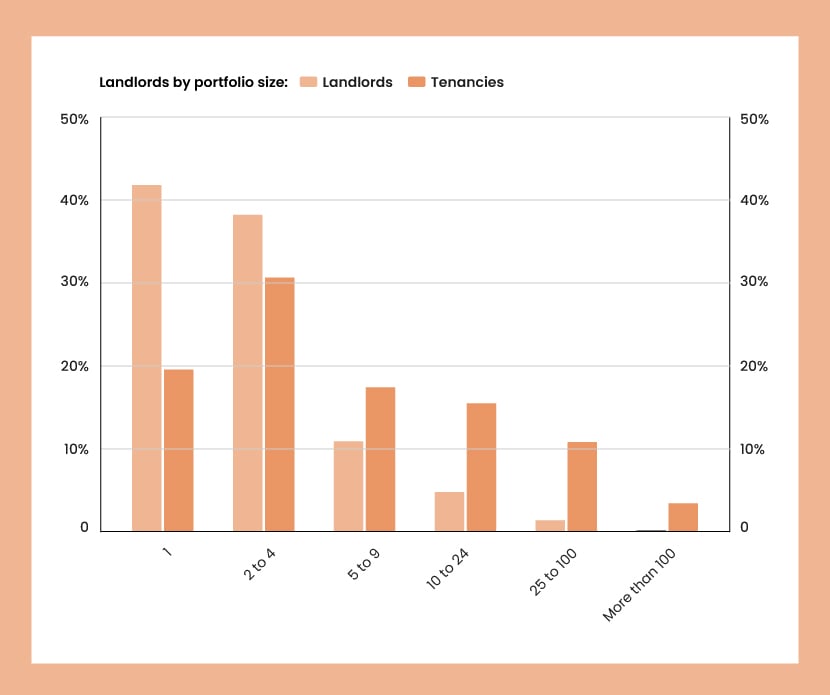
England’s landlord population is primarily dominated by private individuals, representing 93.7% of the country’s landlords. Companies comprise just 4.7%, and a mixture of private and companies forms 1.0%. Regarding portfolio size, less than half of landlords (43.0%) have only 1 property, while 39.3% have between 2 to 4 properties. Landlords with a portfolio size of 5 properties or more make up less than a fifth of the total.
| Landlords by portfolio size | ||
|---|---|---|
| Portfolio size | Landlords | Tenancies |
|
1
|
43%
|
20.1%
|
|
2 to 4
|
39.3%
|
31.5%
|
|
5 to 9
|
11.2%
|
17.9%
|
|
10 to 24
|
4.9%
|
15.9%
|
|
25 to 100
|
1.4%
|
11.1%
|
|
More than 100
|
0.1%
|
3.5%
|
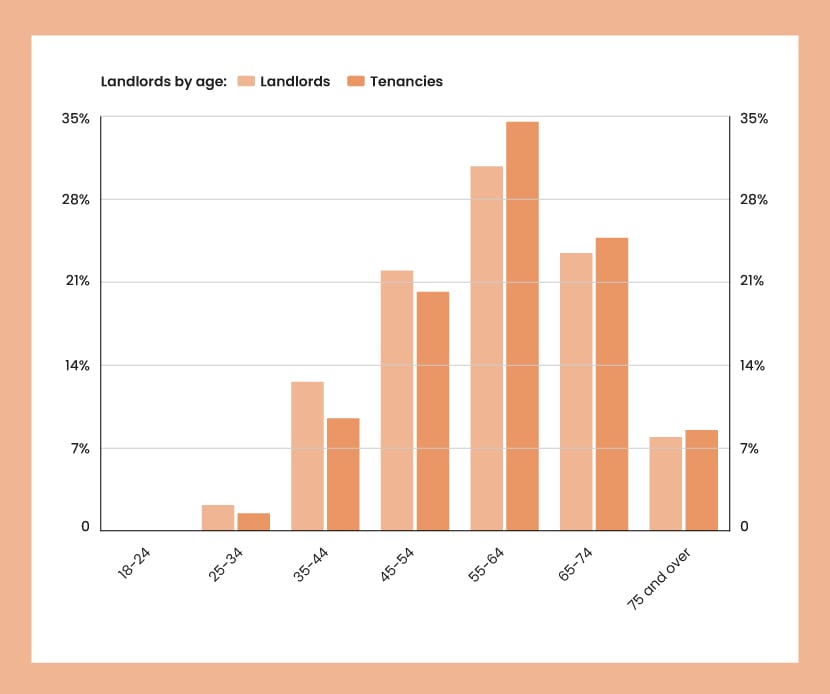
Most of the country’s landlords are aged 55 and above (62.8%). Less than 0.1% of landlords fall in the 18-24 age range, while only 2.2% are 25-34. This indicates that being a landlord is more common among the older age groups.
| Landlords by age | ||
|---|---|---|
| Age | Landlords | Tenancies |
|
18-24
|
0%
|
0%
|
|
25-34
|
2.2%
|
1.5%
|
|
35-44
|
12.7%
|
9.6%
|
|
45-54
|
22.2%
|
20.4%
|
|
55-64
|
31.1%
|
34.9%
|
|
65-74
|
23.7%
|
25%
|
|
75 and over
|
8%
|
8.6%
|
A small minority (8.6%) of landlords have been so for 3 years or less, but the largest group (52.9%) have been landlords for 11 or more years. 38.5% of landlords have been so for 4 to 10 years.
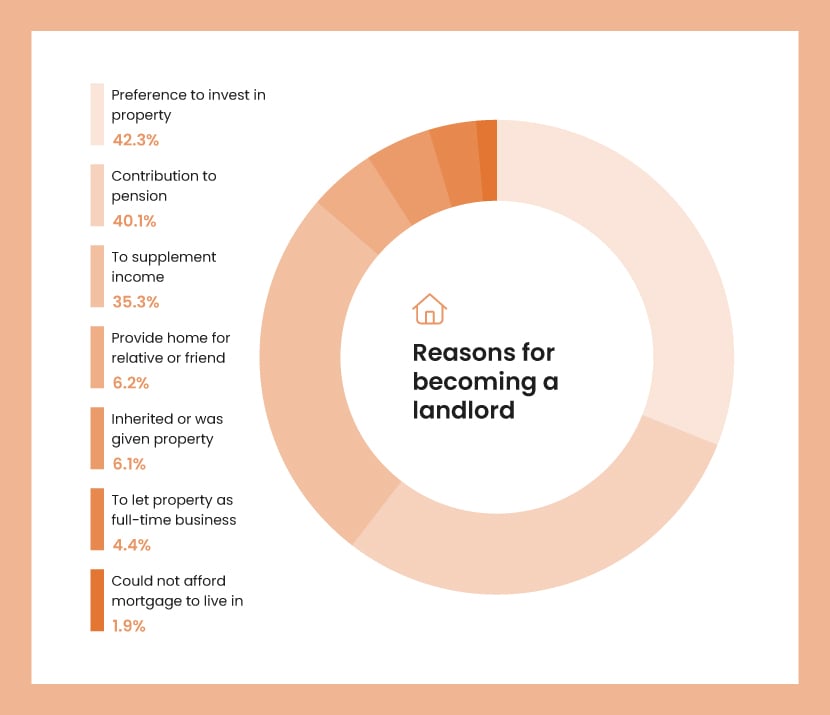
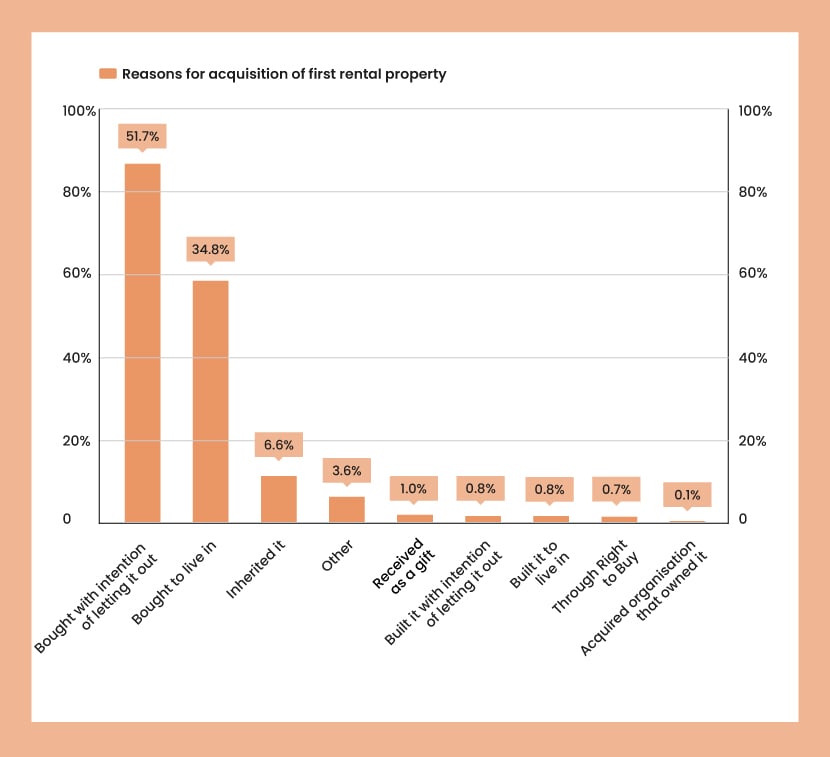
The most popular reason for becoming a landlord is a preference to invest in property (42.3%), followed by a contribution to a pension (40.1%). Most landlords acquired their first rental property to let it out (51.7%), while 34.8% bought it to live in and decided to let it out later.
| Reasons for becoming a landlord | |
|---|---|
| Reason | Percentage |
|
Preference to invest in property
|
42.3%
|
|
Contribution to pension
|
40.1%
|
|
To supplement income
|
35.3%
|
|
Provide home for relative or friend
|
6.2%
|
|
Inherited or was given property
|
6.1%
|
|
To let property as full-time business
|
4.4%
|
|
Could not afford mortgage to live in
|
1.9%
|
| Acquisition of first rental property | |
|---|---|
| Acquisition type | Percentage |
|
Bought with intention of letting it out
|
51.7%
|
|
Bought to live in
|
34.8%
|
|
Inherited it
|
6.6%
|
|
Other
|
3.6%
|
|
Received as a gift
|
1%
|
|
Built it with intention of letting it out
|
0.8%
|
|
Through Right to Buy
|
0.7%
|
|
Acquired organisation that owned it
|
0.1%
|
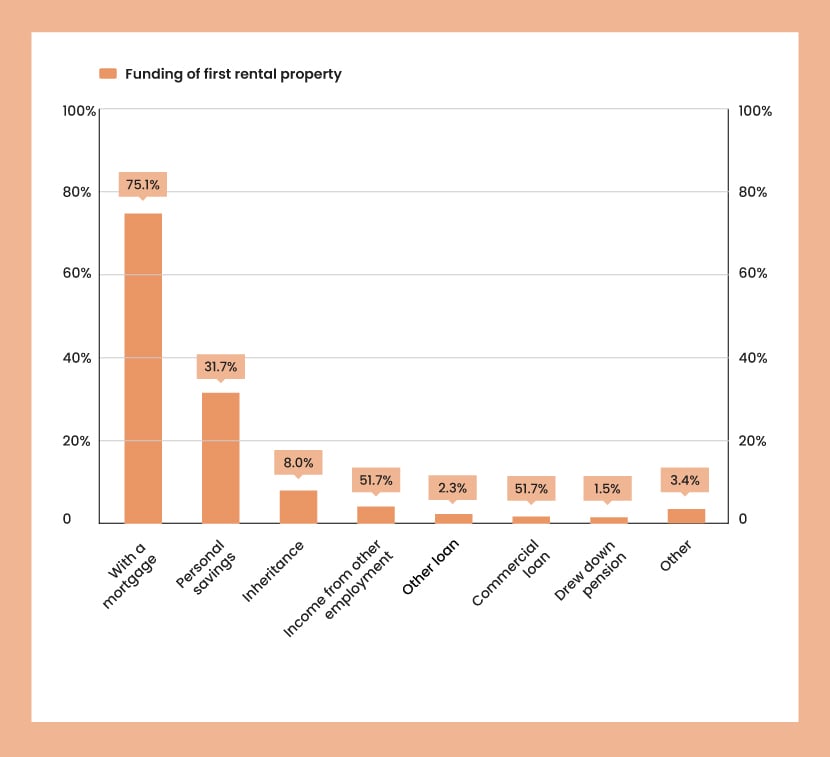
Most landlords’ first rental property purchases were funded with a mortgage (75.1%), with personal savings being the second most common method (31.7%).
| Funding of first rental property | |
|---|---|
| Funding type | Percentage |
|
With a mortgage
|
75.1%
|
|
Personal savings
|
31.7%
|
|
Inheritance
|
8%
|
|
Income from other employment
|
4.1%
|
|
Other loan
|
2.3%
|
|
Commercial loan
|
1.7%
|
|
Drew down pension
|
1.5%
|
|
Other
|
3.4%
|
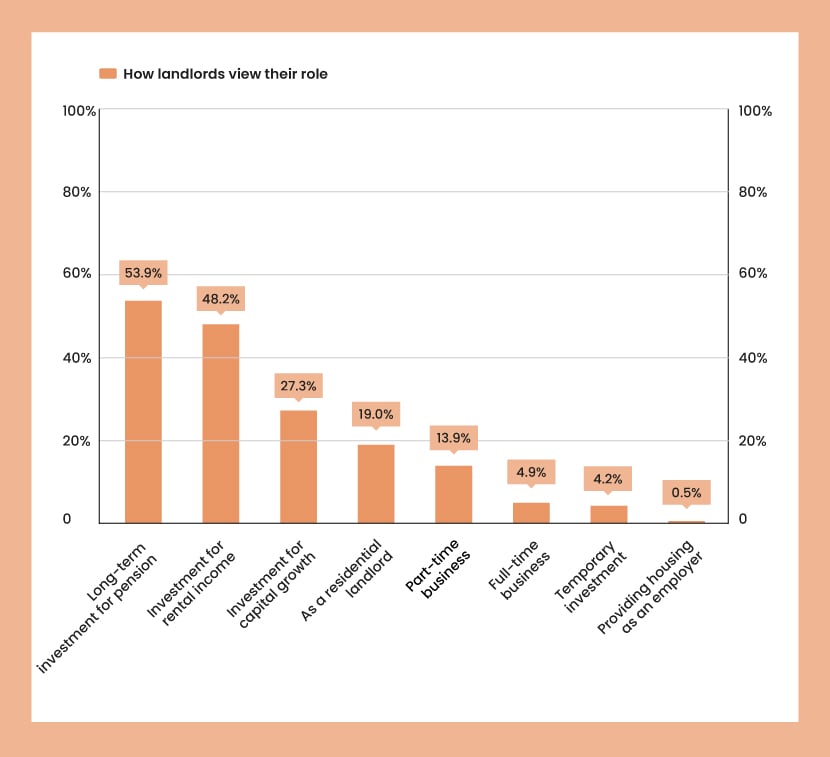
A majority of landlords see their role as a long-term investment for their pension (53.9%), followed by investment for rental income (48.2%) and investment for capital growth (27.3%)
| How landlords view their role | |
|---|---|
| View | Percentage |
|
Long-term inverstment for pension
|
53.9%
|
|
Investment for rental income
|
48.2%
|
|
Investment for capital growth
|
27.3%
|
|
As a residential landlord
|
19%
|
|
Part-time business
|
13.9%
|
|
Full-time business
|
4.9%
|
|
Temporary investment
|
4.2%
|
|
Providing housing as an employer
|
0.5%
|
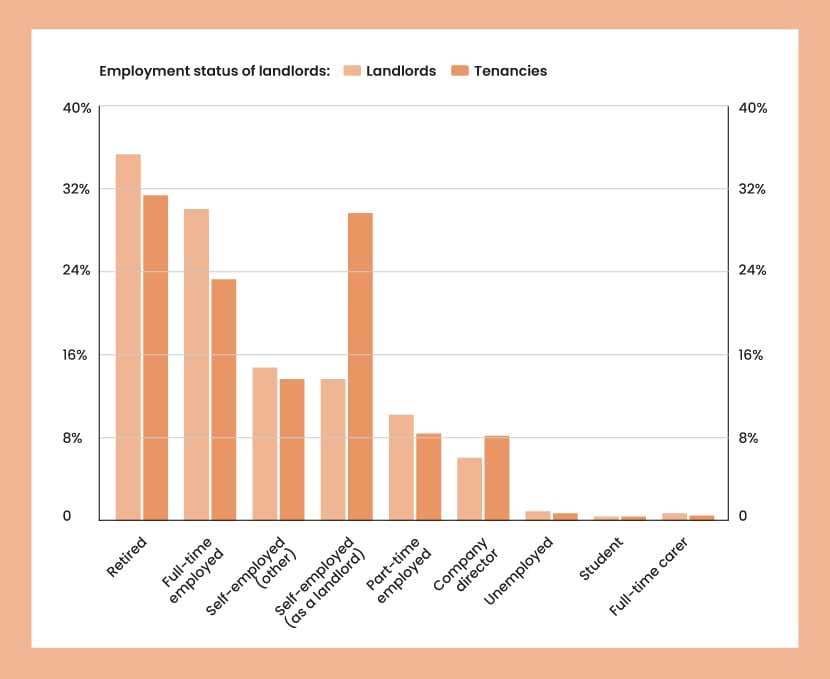
The largest group of landlords are those who are retired (34.9%), followed by those who are full-time employed (29.7%) and self-employed in roles other than as a landlord (14.6%). Self-employment as a landlord represents 13.5% of the group.
| Employment status of landlords | ||
|---|---|---|
| Employment status | Landlords | Tenancies |
|
Retired
|
34.9%
|
31%
|
|
Full-time employed
|
29.7%
|
23%
|
|
Self-employed (other)
|
14.6%
|
13.5%
|
|
Self-employed (as a landlord)
|
13.5%
|
29.3%
|
|
Part-time employed
|
10.1%
|
8.3%
|
|
Company director
|
6%
|
8.1%
|
|
Unemployed
|
0.9%
|
0.7%
|
|
Student
|
0.4%
|
0.4%
|
|
Full-time carer
|
0.7%
|
0.5%
|
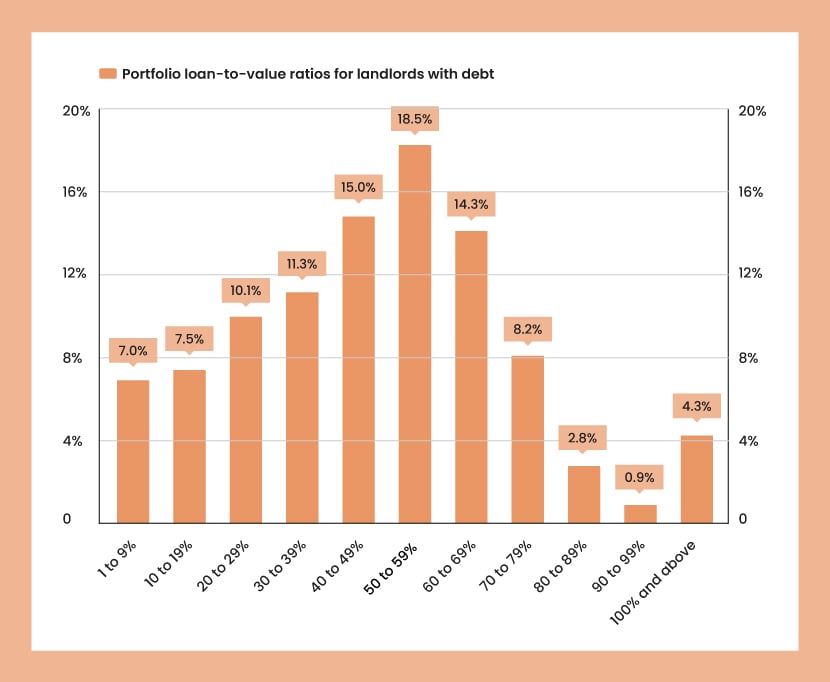
Portfolio loan-to-value ratios for landlords with debt are fairly distributed across the spectrum. Many landlords have loan-to-value ratios of 50-59% (18.5%) and 40-49% (15.0%).
| Portfolio loan-to-value ratios for landlords with debt | |
|---|---|
| Ratio | Percentage |
|
1 to 9%
|
7%
|
|
10 to 19%
|
7.5%
|
|
20 to 29%
|
10.1%
|
|
30 to 39%
|
11.3%
|
|
40 to 49%
|
15%
|
|
50 to 59%
|
18.5%
|
|
60 to 69%
|
14.3%
|
|
70 to 79%
|
8.2%
|
|
80 to 89%
|
2.8%
|
|
80 to 89%
|
2.8%
|
|
90 to 99%
|
0.9%
|
|
100% and above
|
4.3%
|
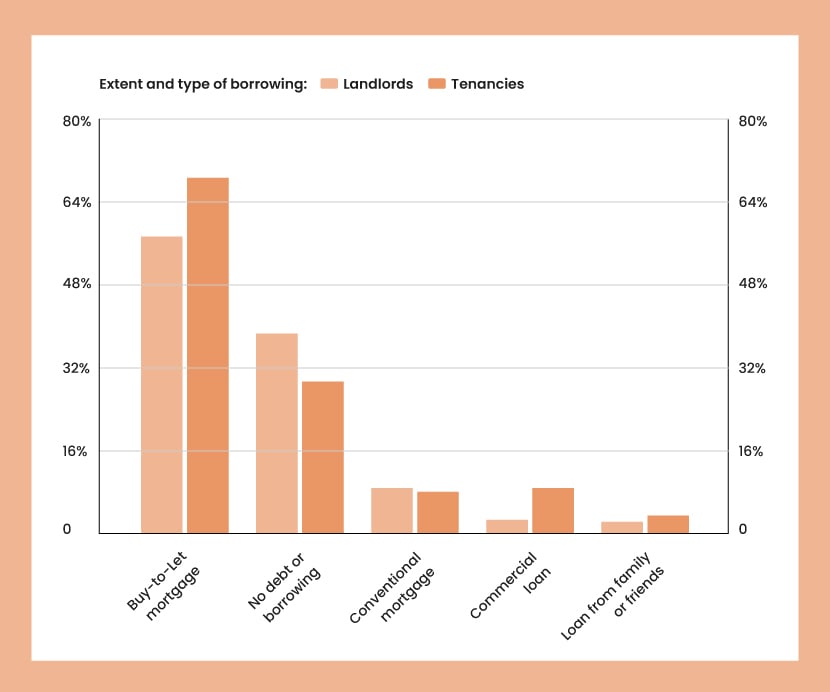
Most landlords (57.0%) have a buy-to-let mortgage. However, 38.3% of landlords report having no debt or borrowing.
| Extent and type of borrowing | ||
|---|---|---|
| Type of borrowing | Landlords | Tenancies |
|
Buy-to-let morgage
|
57%
|
68.3%
|
|
No debt or borrowing
|
38.3%
|
29.1%
|
|
Conventional mortgage
|
8.6%
|
7.9%
|
|
Commercial loan
|
2.5%
|
8.6%
|
|
Loan from family or friends
|
2.1%
|
3.3%
|
Profile of dwellings and households
Just under half of landlords (46.1%) have terraced houses, followed by purpose-built flats or maisonettes (38.7%). Bedsits, rooms, studios, or flatlets comprise the smallest rental property share (4.5%).
| Type of rental property | |
|---|---|
| Property type | Percentage |
|
Terraced house
|
46.1%
|
|
Purpose-built flat or maisonette
|
38.7%
|
|
Semi-detached house
|
31.8%
|
|
Converted flat or maisonette
|
21.3%
|
|
Detached house
|
12.2%
|
|
Bedsit, room, studio or flatlet
|
4.5%
|
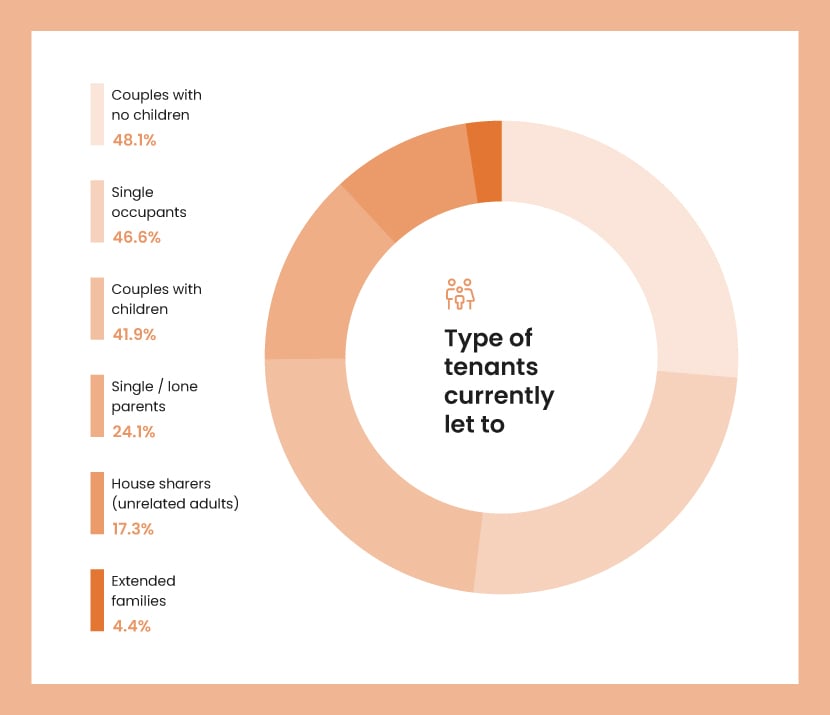
The most significant portion of tenants are couples with no children (48.1%), followed closely by single occupants (46.6%). Extended families constitute the most minor proportion of tenants (4.4%).
| Types of tenants currently let to | |
|---|---|
| Tenant type | Percentage |
|
Couples with no children
|
48.1%
|
|
Single occupants
|
46.6%
|
|
Couples with children
|
41.9%
|
|
Single / lone parents
|
24.1%
|
|
House sharers (unrelated adults)
|
17.3%
|
|
Extended families
|
4.4%
|
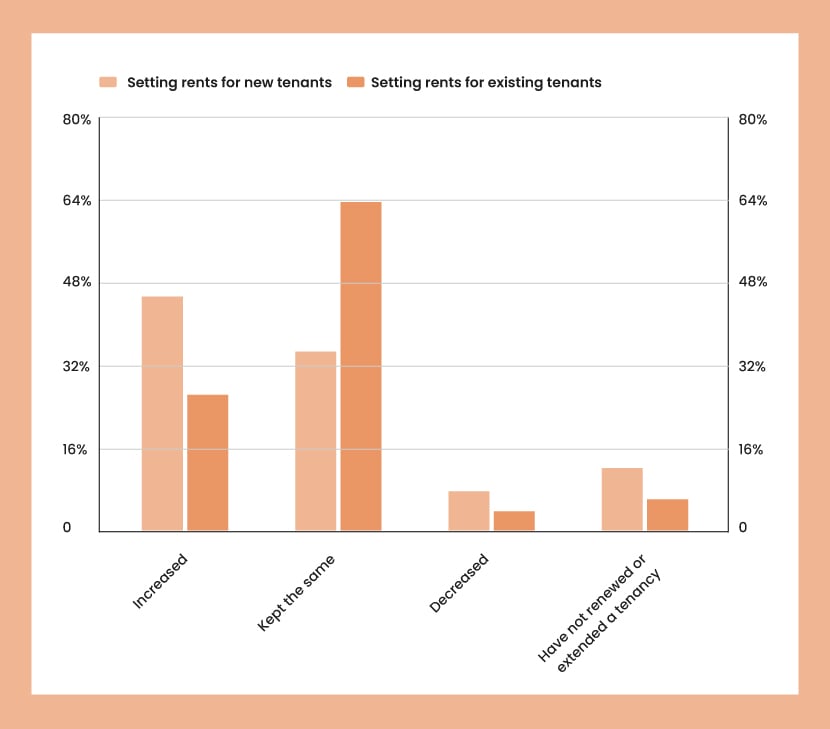
For new tenants, 45.5% of landlords have increased the rent, while most (63.9%) kept the rent the same for existing tenants
| Setting rents for new tenants | |
|---|---|
| Rent | Percentage |
|
Increased
|
45.5%
|
|
Kept the same
|
34.8%
|
|
Decreased
|
7.6%
|
|
First let of property
|
12.1%
|
| Setting rents for existing tenants | |
|---|---|
| Rent | Percentage |
|
Increased
|
26.4%
|
|
Kept the same
|
63.9%
|
|
Decreased
|
3.7%
|
|
First let of property
|
6%
|
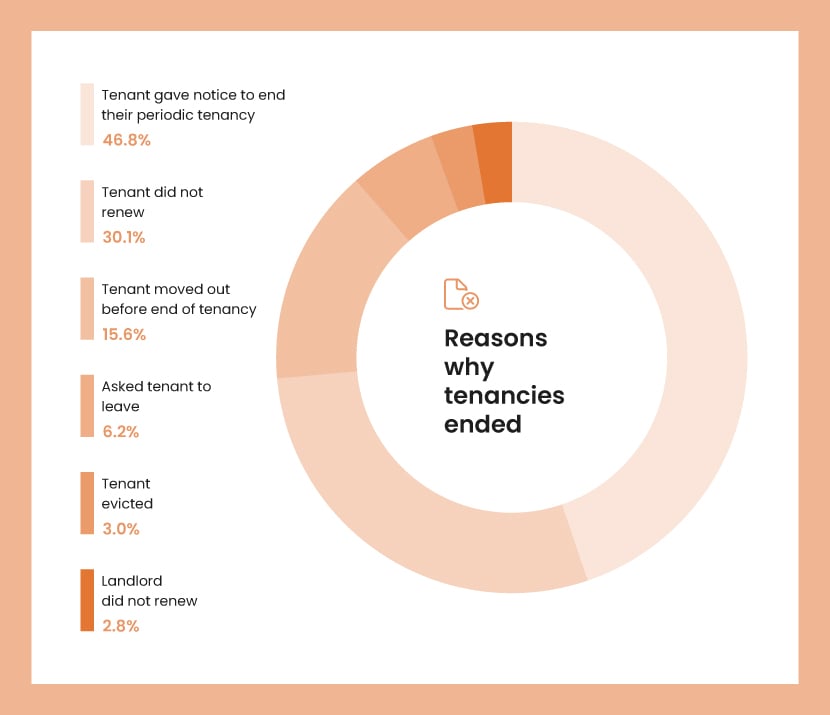
In most cases (46.8%), tenants gave notice to end their periodic tenancy. This is followed by tenants not renewing their leases (30.1%).
| Reasons why tenancies end | |
|---|---|
| Reason | Percentage |
|
Tenant gave notice to end their periodic tenancy
|
46.8%
|
|
Tenant did not renew
|
30.1%
|
|
Tenant moved out before end of tenancy
|
15.6%
|
|
Asked tenant to leave
|
6.2%
|
|
Tenant evicted
|
3%
|
|
Landlord did not renew
|
2.8%
|
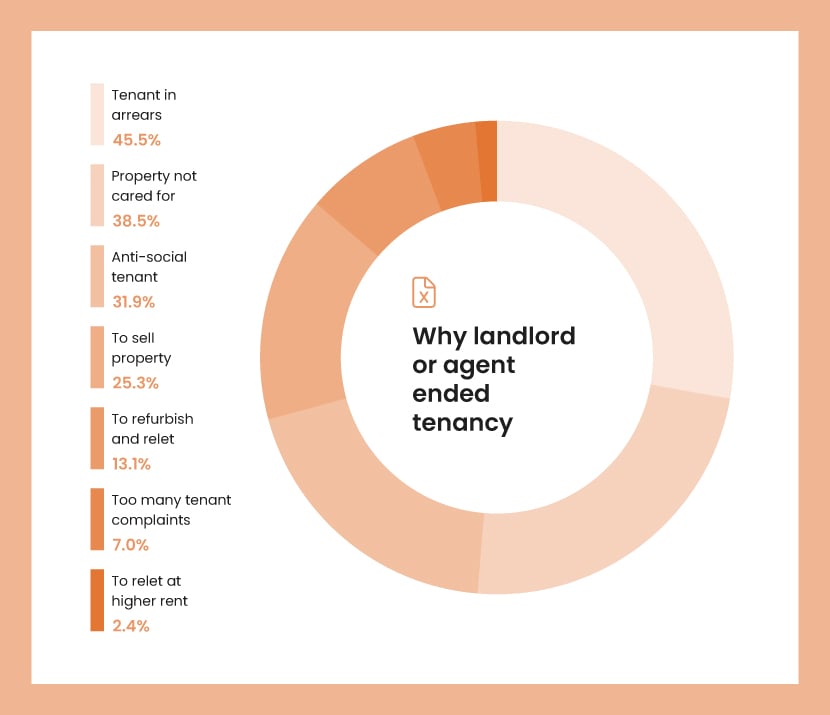
The most common reason for landlords or agents to end tenancies is tenants being in arrears (45.5%), followed by the property not being cared for (38.5%). The least common reason a landlord or agent ends a tenancy is to relet at higher rent (2.4%).
| Why landlord or agent ended tenancy | |
|---|---|
| Reason | Percentage |
|
Tenant in arrears
|
45.5%
|
|
Property not cared for
|
38.5%
|
|
Anti-social tenant
|
31.9%
|
|
To sell property
|
25.3%
|
|
To refurbish and relet
|
13.1%
|
|
Too many tenant complaints
|
7%
|
|
To relet at higher rent
|
2.4%
|
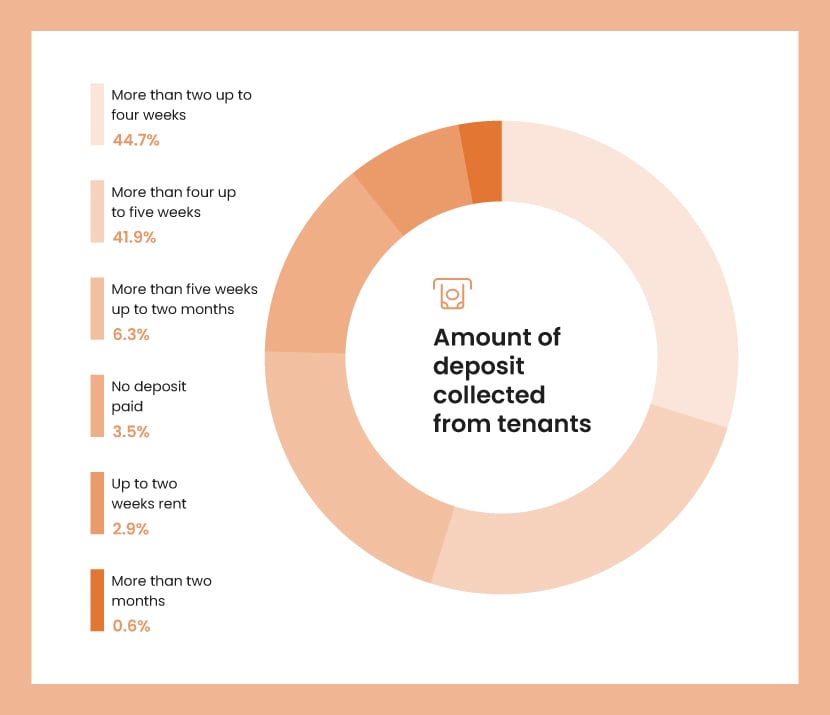
Many landlords (44.7%) collect 2-4 weeks' rent as a deposit, closely followed by landlords who collect more than 4 but up to 5 weeks of rent (41.9%).
| Amount of deposit collected from tenants | |
|---|---|
| Amount | Percentage |
|
More than two up to four weeks
|
44.7%
|
|
More than four up to five weeks
|
41.9%
|
|
More than five weeks up to two months
|
6.3%
|
|
No deposit paid
|
3.5%
|
|
Up to two weeks rent
|
2.9%
|
|
More than two months
|
0.6%
|
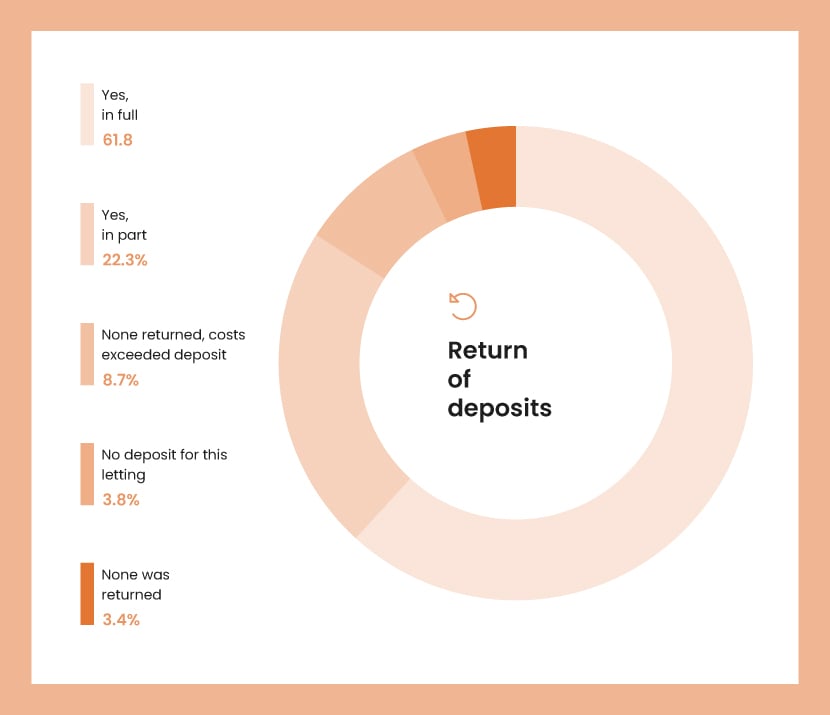
61.8% of landlords returned the deposits, but only a small percentage (12.1%) didn't return any deposits. This was split into 8.7% who returned no deposit due to costs exceeding the deposit and 3.4% where it wasn’t returned for other reasons.
| Return of deposits | |
|---|---|
| Returned | Percentage |
|
Yes, in full
|
61.8%
|
|
Yes, in part
|
22.3%
|
|
None returned, costs exceeded deposit
|
8.7%
|
|
No deposit for this letting
|
3.8%
|
|
None was returned
|
3.4%
|
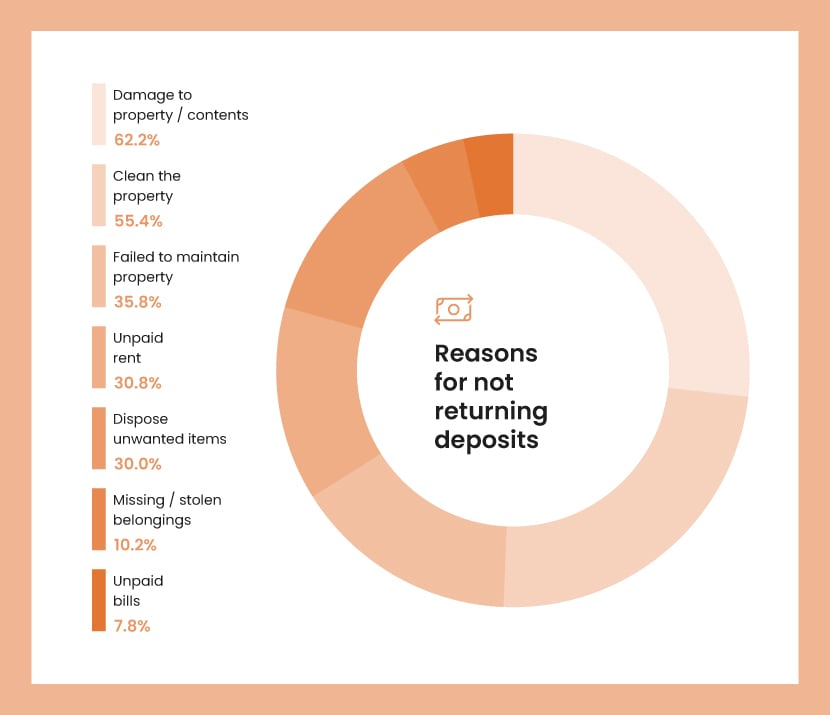
The most common reasons are damage to the property or contents (62.2%) and cleaning the property (55.4%).
| Reasons for not returning deposits | |
|---|---|
| Reason | Percentage |
|
Damage to property / contents
|
62.2%
|
|
Clean the property
|
55.4%
|
|
Failed to maintain property
|
35.8%
|
|
Unpaid rent
|
30.8%
|
|
Dispose unwanted items
|
30%
|
|
Missing / stolen belongings
|
10.2%
|
|
Unpaid bills
|
7.8%
|
Landlord attitudes and practices
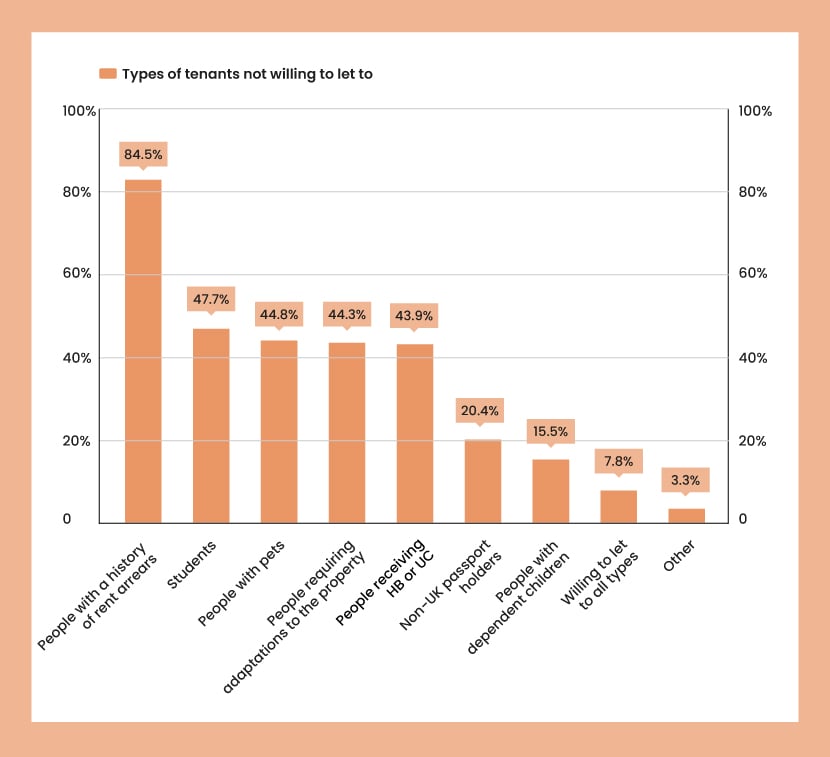
Landlords are most unwilling to let their properties to people with a history of rent arrears (84.5%), followed by students (47.7%) and people with pets (44.8%).
| Types of tenants not willing to let to | |
|---|---|
| Tenant type | Percentage |
|
People with a history of rent arrears
|
84.5%
|
|
Students
|
47.7%
|
|
People with pets
|
44.8%
|
|
People requiring adaptations to the property
|
44.3%
|
|
People receiving HB or UC
|
43.9%
|
|
Non-UK passport holders
|
20.4%
|
|
People with dependent children
|
15.5%
|
|
Willing to let to all types
|
7.8%
|
|
Other
|
3.3%
|
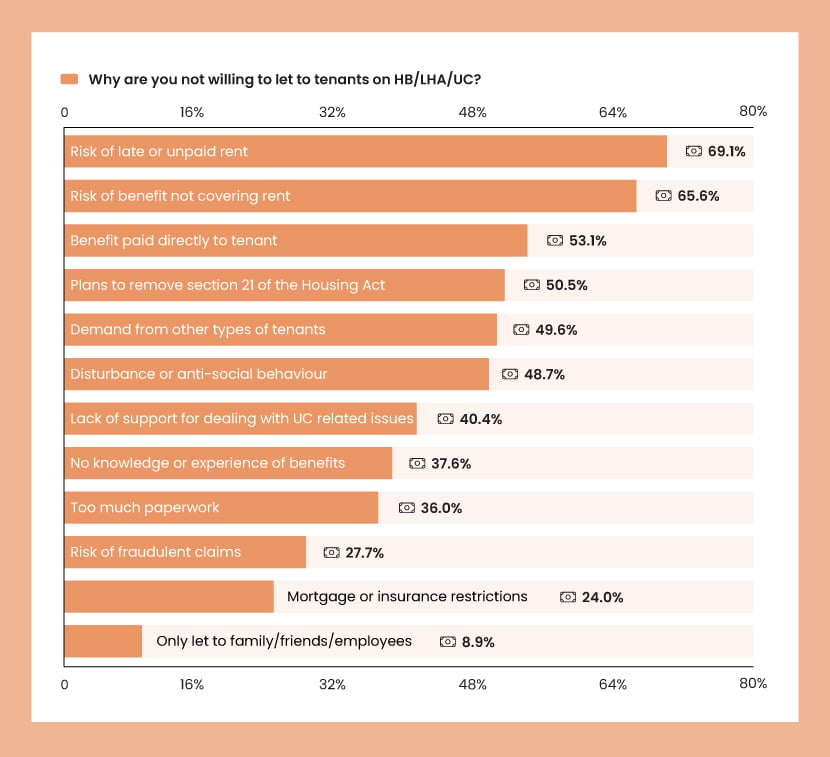
The predominant reason landlords are unwilling to let to tenants on Housing Benefit, Local Housing Allowance, or Universal Credit is the risk of late or unpaid rent (69.1%).
| Why are you not willing to let to tenants on HB/LHA/UC? | |
|---|---|
| Reason | Percentage |
|
Risk of late or unpaid rent
|
69.1%
|
|
Risk of benefit not covering rent
|
65.6%
|
|
Benefit paid directly to tenant
|
53.1%
|
|
Plans to remove section 21 of the Housing act
|
50.5%
|
|
Demand from other types of tenants
|
49.6%
|
|
Disturbance or anti-social behaviour
|
48.7%
|
|
Lack of support for dealing with UC related issues
|
40.4%
|
|
No knowledge or experience of benefits
|
37.6%
|
|
Too much paperwork
|
36%
|
|
Risk of fraudulent
|
27.7%
|
|
Mortgage or insurance restrictions
|
24%
|
|
Only let to family, friends and employees
|
8.9%
|
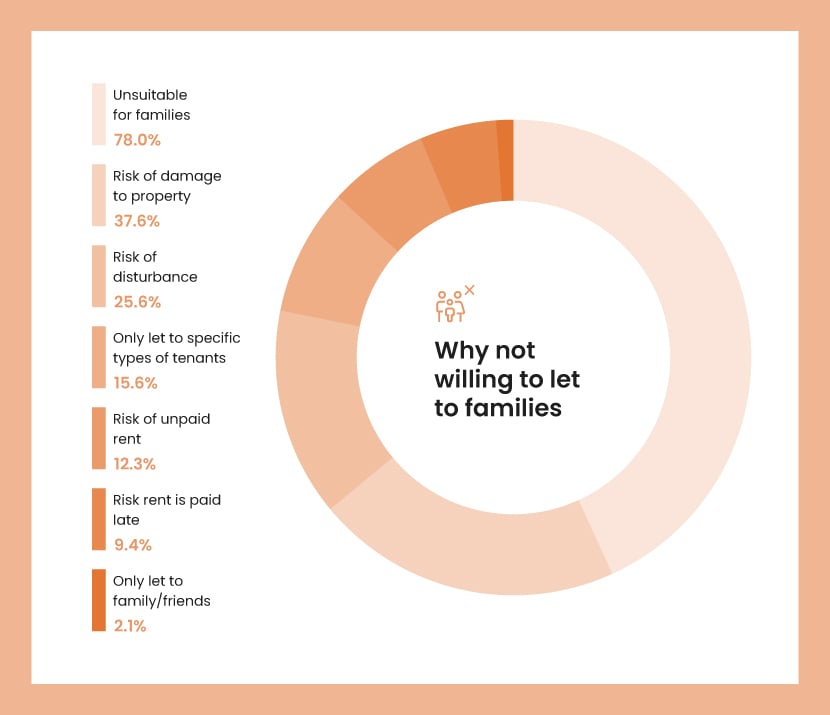
When it comes to families, the property not being suitable for families is the most common reason a landlord wouldn’t be willing to let it.
| Why not willing to let to families | |
|---|---|
| Reason | Percentage |
|
Unsuitable for families
|
78%
|
|
Risk of damage to property
|
37.6%
|
|
Risk of disturbance
|
25.6%
|
|
Only let to specific types of tenants
|
15.6%
|
|
Risk of unpaid rent
|
12.3%
|
|
Risk rent is paid late
|
9.4%
|
|
Only let to family/friends
|
2.1%
|
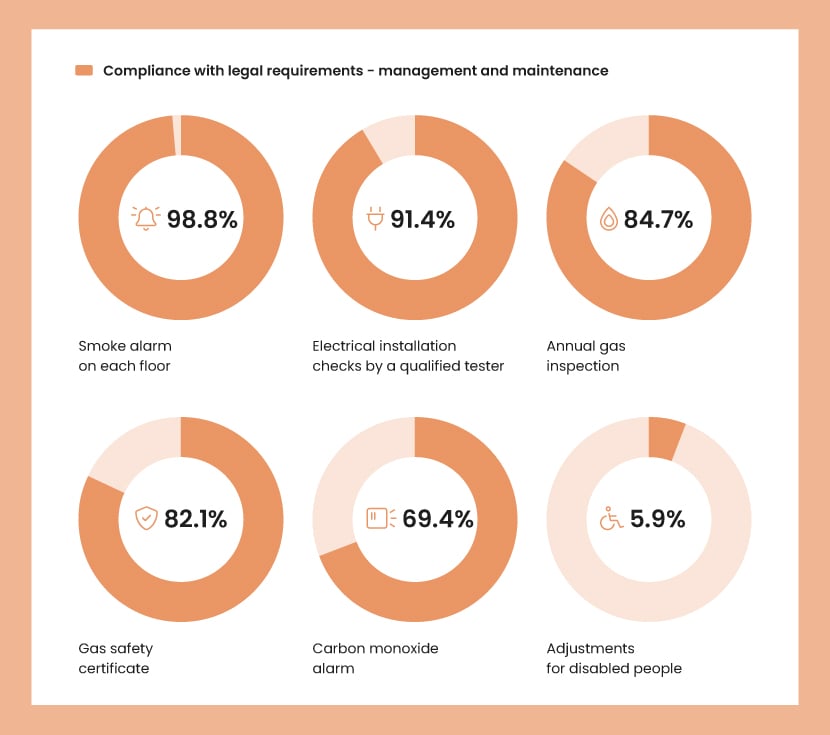
Generally speaking, landlords demonstrate high compliance with legal requirements for management and maintenance. For instance, 98.8% of landlords have a smoke alarm on each floor.
| Compliance with legal requirements - management and maintenance | |
|---|---|
| Legal requirement | Percentage |
|
Smoke alarm on each floor
|
98.8%
|
|
Electrical installation checks by a qualified tester
|
91.4%
|
|
Annual gas inspection
|
84.7%
|
|
Gas safety certificate
|
82.1%
|
|
Carbon monoxide alarm
|
69.4%
|
|
Adjustments for disabled people
|
5.9%
|
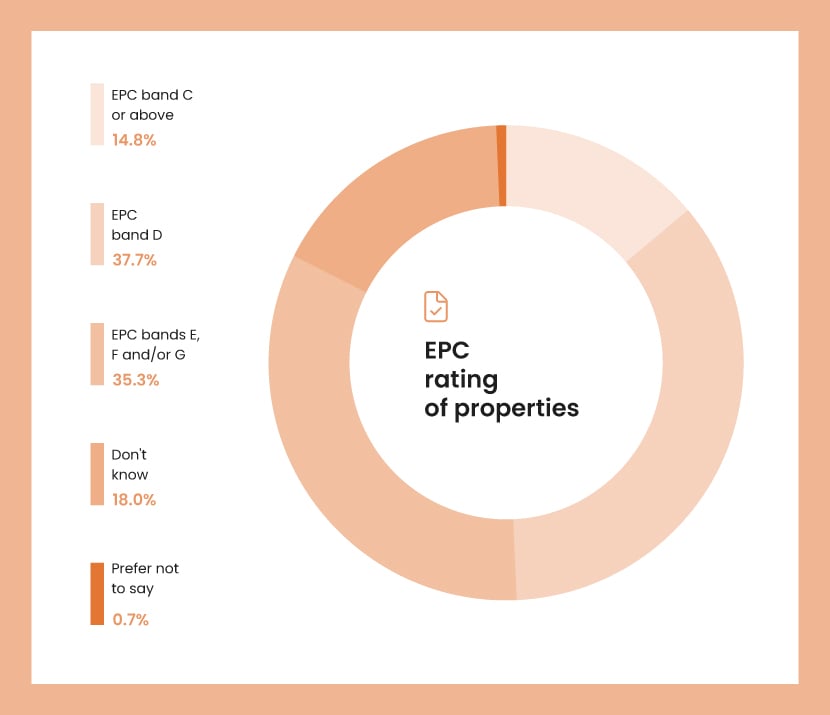
Most landlords’ properties fall into EPC band D (37.7%), with only a tiny fraction (0.7%) of landlords preferring not to disclose this information.
| EPC rating of properties | |
|---|---|
| EPC Rating | Percentage |
|
EPC band C or above
|
14.8%
|
|
EPC band D
|
37.7%
|
|
EPC bands E, F and/or G
|
35.3%
|
|
Don't know
|
18%
|
|
Prefer not to say
|
0.7%
|
The future of the private rented sector
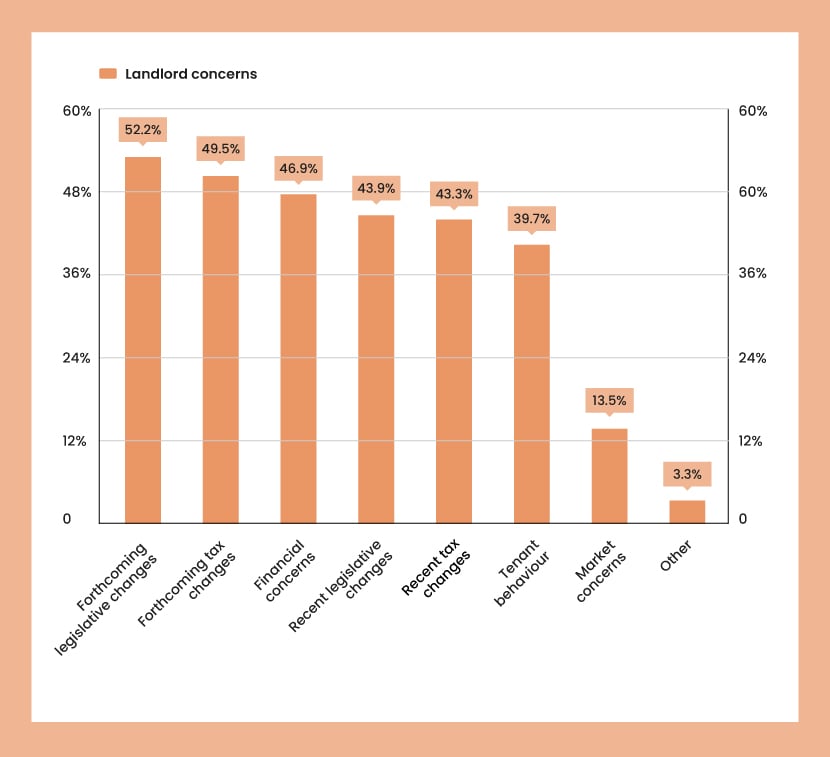
There are several potential worries that landlords have over the future of the industry. Forthcoming legislative changes (52.2%) and forthcoming tax changes (49.5%) are the top 2 concerns, closely followed by financial concerns (46.9%). Other significant problems include recent legislative changes (43.9%) and tax changes (43.3%). Less pressing but still substantial are issues with tenant behaviour (39.7%) and market concerns (13.5%).
| Landlord concerns | |
|---|---|
| Concern | Percentage |
|
Forthcoming legislative changes
|
52.2%
|
|
Forthcoming tax changes
|
49.5%
|
|
Financial concerns
|
46.9%
|
|
Recent legislative changes
|
43.9%
|
|
Recent tax changes
|
43.3%
|
|
Tenant behaviour
|
39.7%
|
|
Market concerns
|
13.5%
|
|
Other
|
3.3%
|
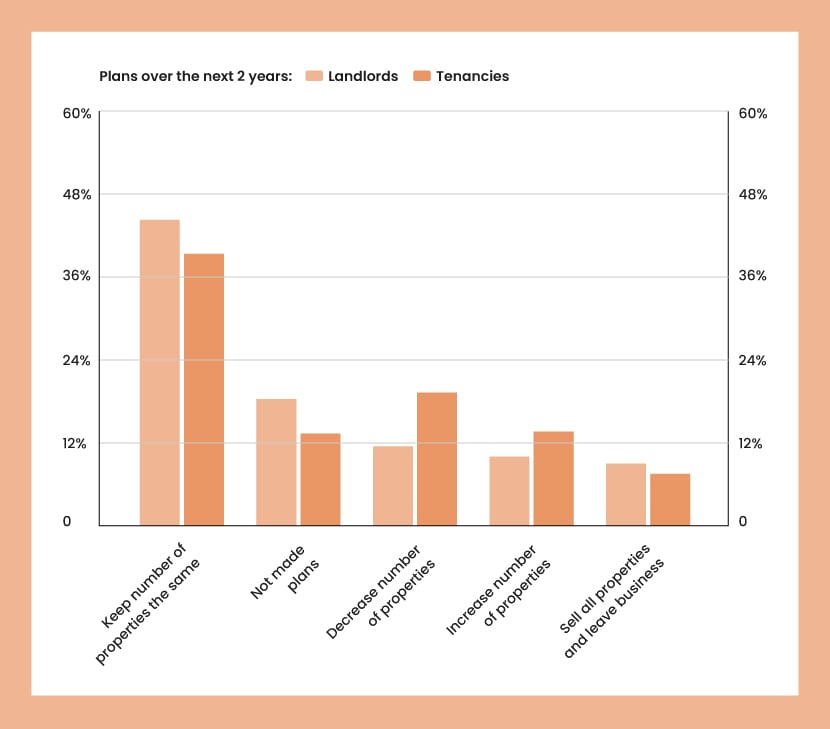
A significant portion of landlords (47.7%) plan to keep their number of properties the same over the next 2 years, while some have yet to make any plans (19.7%). A small fraction of landlords (9.6%) plan to sell all properties and leave the business.
| Plans over the next 2 years | ||
|---|---|---|
| Plan | Landlords | Tenancies |
|
Keep number of properties the same
|
47.7%
|
42.4%
|
|
Not made plans
|
19.7%
|
14.3%
|
|
Decrease number of properties
|
12.3%
|
20.7%
|
|
Increase number of properties
|
10.7%
|
14.6%
|
|
Sell all properties and leave business
|
9.6%
|
8%
|
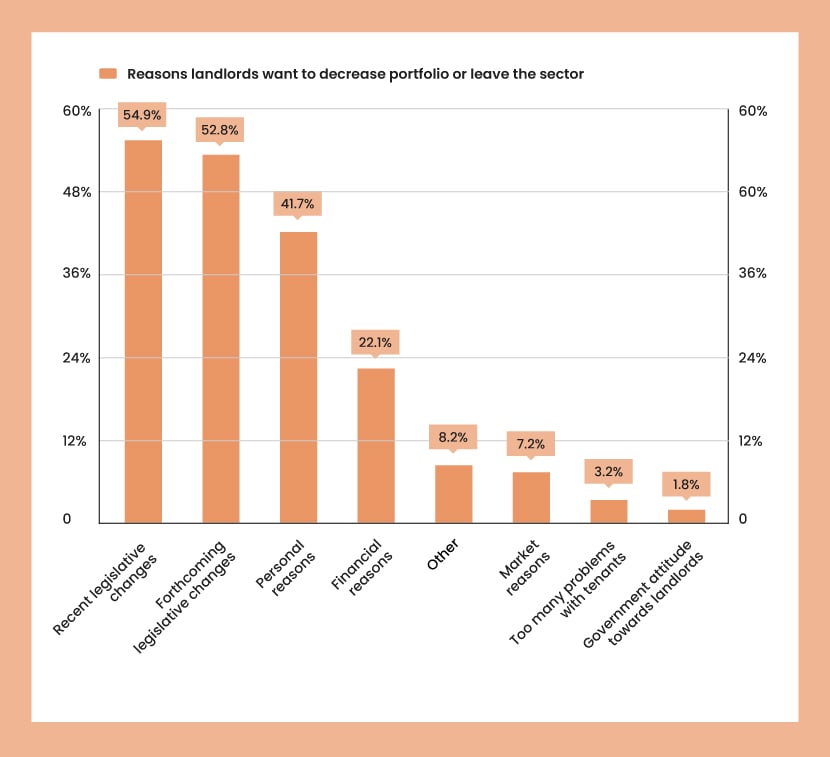
For those who wish to decrease their portfolio or leave the sector altogether, there are several reasons for doing so.
Most landlords attribute this desire to recent legislative changes (54.9%) and forthcoming legislative changes (52.8%). Personal (41.7%) and financial reasons (22.1%) also play a significant role. A smaller group of landlords cite issues like market reasons (7.2%) and tenant problems (3.2%).
| Reasons landlords want to decrease portfolio or leave the sector | |
|---|---|
| Reason | Percentage |
|
Recent legislative changes
|
54.9%
|
|
Forthcoming legislative changes
|
52.8%
|
|
Personal reasons
|
41.7%
|
|
Financial reasons
|
22.1%
|
|
Other
|
8.2%
|
|
Market reasons
|
7.2%
|
|
Too many problems with tenants
|
3.2%
|
|
Government attitude towards landlords
|
1.8%
|
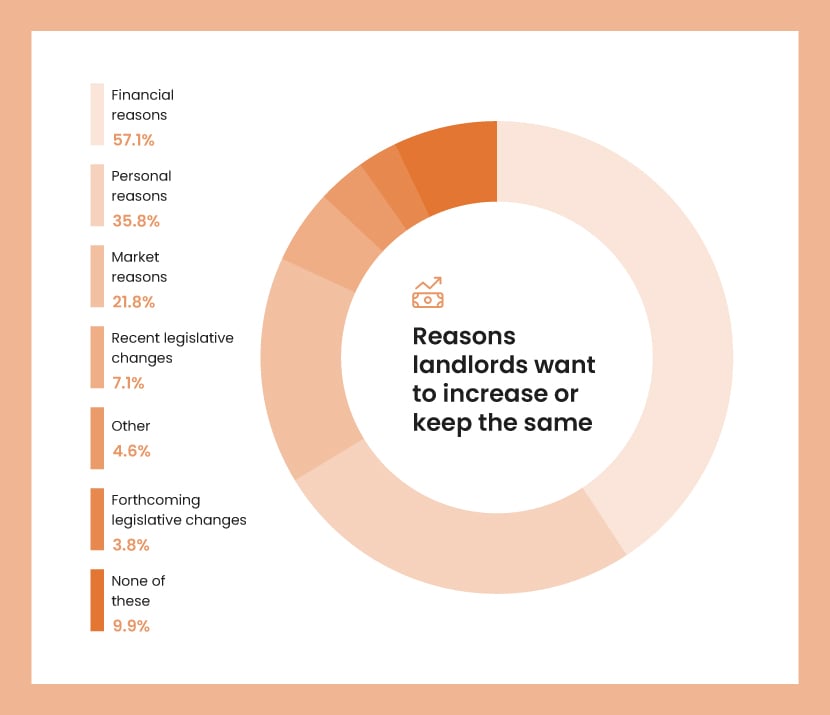
On the other hand, financial reasons are the most prominent for those wanting to increase or keep their portfolio the same, as 57.1% of landlords mentioned. Personal reasons (35.8%) and market reasons (21.8%) also contribute to this decision. Legislative changes (both recent and forthcoming) play a lesser role when landlords consider expanding or maintaining their portfolios.
| Reasons landlords want to increase or keep the same | |
|---|---|
| Reason | Percentage |
|
Financial reasons
|
57.1%
|
|
Personal reasons
|
35.8%
|
|
Market reasons
|
21.8%
|
|
Recent legislative changes
|
7.1%
|
|
Other
|
4.6%
|
|
Forthcoming legislative changes
|
3.8%
|
|
None of these
|
9.9%
|
Best place to buy a buy-to-let property
The rental yield is one of the most important things to consider when choosing where to buy a buy-to-let property. The rental yield is the ratio of the rent you’ll be charging compared to the property's purchase price.
Looking at average rent and property prices across the country, it’s unsurprising that the areas with the highest potential yields are in the most affordable neighbourhoods.
Blackpool is at the top of the list, with a median monthly rent of £550 and an average house price of £130,426. The median rent to average house price ratio is 1:237, indicating that rental income is relatively high compared to the property's purchase price. Two neighbouring Lancashire areas, Burnley and Pendle, follow closely, offering similar rent-to-house price ratios. Also located in the North, Sunderland shares the third spot with Pendle, boasting a median rent-to-house price ratio of 1:253.
Some of the UK’s biggest cities also make the top 10, including Manchester, Newcastle upon Tyne and Nottingham. Other major cities, such as Bristol, Birmingham, and Leeds, offer higher rental incomes but also have higher property prices. On the other hand, slightly smaller cities such as Peterborough, Bournemouth, and Plymouth provide a more balanced rent-to-house price ratio.

| Rank | Area | Median monthly rent | Average house price | Median rent: average house price ratio |
|---|---|---|---|---|
|
1
|
Blackpool
|
£550
|
£130,426
|
1:237
|
|
2
|
Burnley
|
£475
|
£115,454
|
1:243
|
|
3
|
Pendle
|
£525
|
£133,005
|
1:253
|
|
3
|
Sunderland
|
£550
|
£138,954
|
1:253
|
|
5
|
Hyndburn
|
£495
|
£126,658
|
1:256
|
|
6
|
Manchester
|
£900
|
£231,656
|
1:257
|
|
7
|
Newcastle upon Tyne
|
£750
|
£193,150
|
1:258
|
|
8
|
County Durham
|
£495
|
£128,960
|
1:261
|
|
9
|
Nottingham
|
£725
|
£190,354
|
1:263
|
|
10
|
Salford
|
£825
|
£217,856
|
1:264
|
How many buy-to-let mortgages are in arrears?
When a debt is overdue, it’s considered in ‘arrears’. As of the second quarter of 2023, 8,980 buy-to-let mortgages were in arrears, accounting for 0.44% of outstanding mortgages.
Most of these were just arrears of 2.5% to 5% of the balance, although there were 1,870 in arrears of over 10%.
The total number of buy-to-let mortgages in arrears has increased in the last couple of years, growing by over half since Q2 2020. They now stand at their highest level of the previous 2 years.
This is a concerning trend for the sector, as it shows just how much of an impact the cost of living crisis has had.
| Mortgages in arrears (number) | 20-Q2 | 20-Q3 | 20-Q4 | 21-Q1 | 21-Q2 | 21-Q3 | 21-Q4 | 22-Q1 | 22-Q2 | 22-Q3 | 22-Q4 | 23-Q1 | 23-Q2 |
|---|---|---|---|---|---|---|---|---|---|---|---|---|---|
|
Arrears of 2.5%-5% of balance
|
2,760
|
2,860
|
3,090
|
2,820
|
2,730
|
2,440
|
2,470
|
2,380
|
2,130
|
2,290
|
2,570
|
3,420
|
4,810
|
|
Arrears of 5%-7.5% of balance
|
1,110
|
1,220
|
1,290
|
1,170
|
1,200
|
1,130
|
1,200
|
1,130
|
1,120
|
1,090
|
1,080
|
1,210
|
1,490
|
|
Arrears of 7.5%-10% of balance
|
500
|
620
|
670
|
580
|
590
|
610
|
610
|
600
|
600
|
600
|
640
|
660
|
810
|
|
Arrears over 10% of balance
|
1,430
|
1,520
|
1,650
|
1,610
|
1,740
|
1,700
|
1,730
|
1,760
|
1,790
|
1,780
|
1,770
|
1,740
|
1,870
|
|
All arrears of over 2.5% of balance
|
5,800
|
6,220
|
6,700
|
6,180
|
6,260
|
5,880
|
6,010
|
5,870
|
5,640
|
5,760
|
6,060
|
7,030
|
8,980
|
| Mortgages in arrears (% of mortgages outstanding) | 20-Q2 | 20-Q3 | 20-Q4 | 21-Q1 | 21-Q2 | 21-Q3 | 21-Q4 | 22-Q1 | 22-Q2 | 22-Q3 | 22-Q4 | 23-Q1 | 23-Q2 |
|---|---|---|---|---|---|---|---|---|---|---|---|---|---|
|
Arrears of 2.5%-5% of balance
|
0.14%
|
0.15%
|
0.16%
|
0.14%
|
0.14%
|
0.12%
|
0.12%
|
0.12%
|
0.10%
|
0.11%
|
0.13%
|
0.17%
|
0.24%
|
|
Arrears of 5%-7.5% of balance
|
0.06%
|
0.06%
|
0.07%
|
0.06%
|
0.06%
|
0.06%
|
0.06%
|
0.06%
|
0.05%
|
0.05%
|
0.05%
|
0.06%
|
0.07%
|
|
Arrears of 7.5%-10% of balance
|
0.03%
|
0.03%
|
0.03%
|
0.03%
|
0.03%
|
0.03%
|
0.03%
|
0.03%
|
0.03%
|
0.03%
|
0.03%
|
0.03%
|
0.04%
|
|
Arrears over 10% of balance
|
0.07%
|
0.08%
|
0.08%
|
0.08%
|
0.09%
|
0.08%
|
0.09%
|
0.09%
|
0.09%
|
0.09%
|
0.09%
|
0.09%
|
0.09%
|
|
All arrears of over 2.5% of balance
|
0.30%
|
0.32%
|
0.34%
|
0.31%
|
0.31%
|
0.29%
|
0.30%
|
0.29%
|
0.28%
|
0.28%
|
0.30%
|
0.34%
|
0.44%
|
Frequently asked questions
What is a buy-to-let mortgage?
A buy-to-let mortgage is a loan specifically designed for investors who want to buy property to rent out to others. It's a mortgage product tailored for those who want to ‘buy to let’ instead of ’buy to live in’.
Critical aspects of buy-to-let mortgages often include:
-
Higher interest rates: Unlike residential mortgages, buy-to-let mortgages typically have higher interest rates.
-
Larger deposit: The deposit required for a buy-to-let mortgage is typically higher than that needed for a residential mortgage. You might be required to put down 20-40% of the property's value as a deposit, though this can vary depending on the lender and your circumstances.
-
Rental income requirements: Many lenders assess your affordability for a buy-to-let mortgage based on the potential rental income from the property. Lenders typically want rental income to be 125-145% of your mortgage payment to cover vacancies and other letting costs.
-
Limited availability: Not all lenders offer buy-to-let mortgages, and those that do may have stricter lending criteria than their residential mortgage offerings.
-
Fees: These mortgages may have higher arrangement and valuation fees than residential mortgages.
Remember, if you're considering investing in a buy-to-let property, fully understanding the costs, legal obligations and risks involved is crucial. It might be beneficial to seek financial advice before proceeding.
How much stamp duty do landlords pay?
Stamp duty land tax (SDLT) is a tax home buyers pay when buying property or land over a specific price in England and Northern Ireland. Similar taxes exist in Scotland, known as Land and Buildings Transaction Tax (LBTT), and in Wales, known as Land Transaction Tax (LTT). The tax rate is tiered, so the amount you pay depends on the property price.
If you buy a property in England or Northern Ireland to rent out as a second home or a buy-to-let investment, you usually have to pay an extra 3% in stamp duty on top of the standard rates. This additional charge applies to each band.
Buy-to-let investors in Scotland and Wales also face increased LBTT and LTT costs. Any second property purchases over £40,000 in Scotland are subject to a 6% Additional Dwelling Supplement. In Wales, you usually pay an extra 4% charge in addition to the standard LTT rates.
What income tax do landlords pay?
In the United Kingdom, landlords are required to pay tax on the profit they make from renting out property. The tax is not on the total income but the profit, calculated as income minus allowable expenses. Here are the tax rates for the tax year 2023/2024 (these rates are subject to change in future years):
-
Basic Rate: The basic income tax rate in the UK is 20%, which applies to taxable income up to £50,270.
-
Higher Rate: If a landlord's income, including rental profits, is between £50,271 and £124,140, the higher rate of 40% applies.
-
Additional Rate: For those with income over £125,140, the additional rate of 45% applies.
Remember, landlords are entitled to a personal allowance (£12,570 for the tax year 2023/2024) on the income they can earn before paying taxes. The personal allowance is gradually reduced if their income (from all sources, not just rental income) exceeds £100,000.
Landlords can also deduct certain costs from their taxable rental income to reduce the amount of tax they pay. These include charges such as
- Letting agents' fees
- Legal fees for lets of a year or less or for renewing a lease for less than 50 years
- Accountant’s fees
- Buildings and contents insurance
- Interest on property loans
- Maintenance and repairs to the property (but not improvements)
- Utility bills (like gas, water and electricity)
- Rent, ground rent, service charges
- Council Tax
- Services paid for by the landlord (like cleaning or gardening)
However, since April 2020, how tax relief on rental income is calculated has changed. Landlords can no longer deduct their mortgage expenses from their rental income to reduce their tax bill. Instead, they get a tax credit based on 20% of their mortgage interest payments.
Please note all figures and rates are subject to change. It's always wise to consult a financial advisor or tax expert for the most accurate and current information.
Remember to keep accurate records of your income and expenses, as you need this information to complete your Self Assessment tax return if you're renting out a property in the UK. If you fail to report this income or pay the appropriate amount of tax, you could face penalties from HM Revenue and Customs (HMRC).
Methodology
What percentage of UK properties are rentals?
- The Department for Levelling Up, Housing and Communities’ English Housing Survey data on stock profile.
- The Scottish Government’s housing statistics: Stock by tenure.
- StatsWales’ dwelling stock estimates
- The Department for Communities’ Northern Ireland Housing Statistics.
What percentage of UK mortgages are buy-to-let>
The FCA’s mortgage lending statistics - June 2023
The buy-to-let mortgage market size through the years
The FCA's mortgage lending statistics - June 2023
Calculated using the average deposit percentage from MoneyHelper and the average UK house price from HM Land Registry’s UK House Price Index.
Buy to Let Stamp Duty rates
GOV.UK (the Wayback Machine was used to source rates for previous years).
Landlord statistics
The Department for Levelling Up, Housing and Communities’ English Private Landlord Survey 2021: main report.
What income tax do landlords pay?
GOV.UK
Best place to buy a buy-to-let property
Calculated by dividing the average house price (from HM Land Registry’s UK House Price Index) by the average monthly rent (from the Office for National Statistics’ private rental market summary statistics in England).
Buy-to-let mortgage arrears
Sourced from UK Finance’s arrears and possessions data.